Curated OER
Vital Signs
Students research health-related topics such as good nutrition, exercise, and the human body. They analyze their data and distribute it through the use of the Internet.
Georgetown University
Cup-Activity: Writing Equations From Data
Determine how cup stacking relates to linear equations. Pupils stack cups and record the heights. Using the data collected, learners develop a linear equation that models the height. The scholars then interpret the slope and the...
Virginia Department of Education
Numbers in a Name
What's in a name? Pupils create a data set from the number of letters in the names of classmates. Each group then takes the data and creates a visual representation, such as a histogram, circle graph, stem-and-leaf plot, etc.
Curated OER
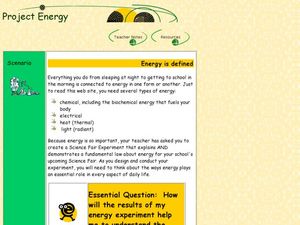
Project Energy
Students explore multiple types of energy. In this energy instructional activity, students prepare a science fair project through completing a WebQuest. Students investigate radiant, thermal, and biochemical energy.
Curated OER
Solar Car Series: During what part of the day can t most Sun power be collected?
Students participate in an outdoor activity in which they make direct but safe observations of the Sun. Students use a solar cell and voltmeter apparatus to collect data on the amount of DC voltage produced by the solar cell during a...
Curated OER
Black History Project
Third graders explore and analyze about famous African-Americans by listening to four picture book biographies. They generate a list of 15 famous African-Americans and then create a survey to rank them according to importance of...
Curated OER
Obstacles to Success: Misleading Data
Eleventh graders explore how data reported by country agencies can mislead the public intentionally or unintentionally. In this Cross Curricular activity, 11th graders analyze charts and graphs in order to draw conclusions. Students...
Curated OER
Mystery Liquids: Linear Function
High schoolers determine the linear equations of the density of water and oil by collecting data on the mass of various volumes of each liquid. They construct scatter plots from the data and use these to write the linear equations for...
Curated OER
Variation and Heredity
Junior geneticists tally eye color and height in their lab groups. They examine certain traits in soybean and corn seedlings. For each activity, they gather data and learn about continuous and discontinuous genetic variation. In another...
Curated OER
Biology Project: Gone Fishing
Students write a scientific article using data and prediction skills. In this scientific writing lesson, students access data about fishing off the coast of New Jersey. They look at satellite data, fluorometry and CTD data over a 3 -4...
Curated OER
Using Excel to Reference and Graph Live Data from a Web Site
Students collect live buoy data about water temperatures in the Gulf of Mexico from the Internet and work individually to organize their data and create a line graph using Excel Spreadsheet. Students analyze their data and examine any...
Curated OER
Animal Science Research Report
Students research an animal. In this research lesson, students utilize various types of technology to gather information about an animal. Students create a class blog and use digital photography for their research.
Curated OER
Survey Project
Eighth graders create a website using FrontPage. They use inserted forms to collect survey information and use Microsoft Excel and MS Word to create a presentation of the survey and the results.
Curated OER
Squares in the Light
Students collect and analyze data using a graph. In this algebra lesson, students explain their findings orally and with a graph. They use their knowledge to solve real life scenarios.
Curated OER
Plotting Data on a Graph
Young scholars investigate graphing. For this graphing lesson, students survey the class and create graphs to reflect the data collected.
Curated OER
Graphing Data Brings Understanding
Students collect, graph and analyze data. In this statistics lesson, students use circle, pie, bar and lines to represent data. They analyze the data and make predictions bases on the scatter plots created.
Curated OER
Groundwater and Ecology
Students are presented a problem concerning an aquifer which may be in danger from overuse by agriculture/industry. They compile data and consult online data and experts in creating a proposal to rectify the situation.
Curated OER
Back In The "Old Days"
Fifth graders collect data during their worker interviews while in groups to compile job changes. They analyze the data to determine the categories of changes, patterns/trends of change and future projections. Each group then develops a...
Curated OER
Sweethearts and Data Analysis
Learners explore the concept collecting and representing data. In this collecting and representing data lesson, students record the different colors of sweetheart candies in their sweethearts box. Learners create a table of the data and...
Curated OER
Generating and Recording Data
Students demonstrate their ability to collect, organize, and display data. They examine everyday objects that can be turned into a function machine for the lesson plan. They use colored fish to help them organize their data.
Code.org
Check Your Assumptions
Always check your assumptions when interpreting data and data visualizations. That's the take away from this exercise. Class members examine a failed project that looks at search trends to predict flu outbreaks and consider the...
Curated OER
Machine Technology
Students work in pairs to manufacture a product for a potential customer. They interview potential customers and collect data. Students develop a customer interview profile. They manufacture drill drift part to customer's specifications...
Curated OER
Power Metering Project
High schoolers collect and analyze variable data and understand the concept of electrical power. In this energy lesson students use a spreadsheet to manage their data and create box plots.
Curated OER
An Introduction to Data Reading and Computations
Students discover data reading and computations. In this math lesson plan, students collect nutritional data about intakes of certain foods compared with daily recommended allowances. Students create their own data charts based on their...


