Curated OER
Vital Signs
Students research health-related topics such as good nutrition, exercise, and the human body. They analyze their data and distribute it through the use of the Internet.
Radford University
Survey Activity
It's time to take a survey. After looking at an example of a survey on lunch preferences, groups design their own surveys. They consider the sample size and sampling technique, then conduct the surveys. As a final activity, they create...
Georgetown University
Cup-Activity: Writing Equations From Data
Determine how cup stacking relates to linear equations. Pupils stack cups and record the heights. Using the data collected, learners develop a linear equation that models the height. The scholars then interpret the slope and the...
PBS
Plants Count
Changes to habitats mean changes to resources. Groups examine aerial maps to predict areas of low and high plant resources. After formulating a plan, they visit the areas to collect data about the plant resources and then share their...
Virginia Department of Education
Numbers in a Name
What's in a name? Pupils create a data set from the number of letters in the names of classmates. Each group then takes the data and creates a visual representation, such as a histogram, circle graph, stem-and-leaf plot, etc.
Curated OER
The Upper Palouse Restoration Project
Students become competent, to collect, record, and interpret information about a particular project they are undertaking. They apply the data and interpret them to analyze the environmental impact of a restoration project.
Curated OER
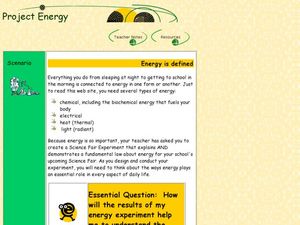
Project Energy
Students explore multiple types of energy. In this energy instructional activity, students prepare a science fair project through completing a WebQuest. Students investigate radiant, thermal, and biochemical energy.
Curated OER
Solar Car Series: During what part of the day can t most Sun power be collected?
Students participate in an outdoor activity in which they make direct but safe observations of the Sun. Students use a solar cell and voltmeter apparatus to collect data on the amount of DC voltage produced by the solar cell during a...
Curated OER
Black History Project
Third graders explore and analyze about famous African-Americans by listening to four picture book biographies. They generate a list of 15 famous African-Americans and then create a survey to rank them according to importance of...
Curated OER
Obstacles to Success: Misleading Data
Eleventh graders explore how data reported by country agencies can mislead the public intentionally or unintentionally. In this Cross Curricular activity, 11th graders analyze charts and graphs in order to draw conclusions. Students...
Curated OER
Mystery Liquids: Linear Function
High schoolers determine the linear equations of the density of water and oil by collecting data on the mass of various volumes of each liquid. They construct scatter plots from the data and use these to write the linear equations for...
Curated OER
Variation and Heredity
Junior geneticists tally eye color and height in their lab groups. They examine certain traits in soybean and corn seedlings. For each activity, they gather data and learn about continuous and discontinuous genetic variation. In another...
Worchester Polytechnic Institute
Interactive Laboratory Activities for Secondary Education
Do you think the lab smells like rotten eggs? Sorry to hear about your sulfering. A set of five experiments covers many different topics including seasons, gravity, food, precipitation, and photosynthesis. Though not presented as a...
Intel
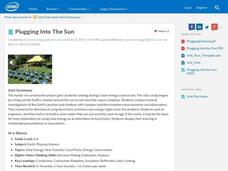
Plugging into the Sun
What's cooking? A sizzling STEM unit challenges scholars to build a solar cooker that can successfully cook an egg. The unit opens with a study of Earth's rotation, the sun's energy, and shadows. Pupils use a compass and thermometer to...
Curated OER
Biology Project: Gone Fishing
Students write a scientific article using data and prediction skills. In this scientific writing lesson, students access data about fishing off the coast of New Jersey. They look at satellite data, fluorometry and CTD data over a 3 -4...
Curated OER
Using Excel to Reference and Graph Live Data from a Web Site
Students collect live buoy data about water temperatures in the Gulf of Mexico from the Internet and work individually to organize their data and create a line graph using Excel Spreadsheet. Students analyze their data and examine any...
Curated OER
Animal Science Research Report
Students research an animal. In this research lesson, students utilize various types of technology to gather information about an animal. Students create a class blog and use digital photography for their research.
Curated OER
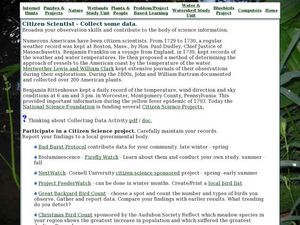
Citizen Scientist - Collect Some Data
In this science project worksheet, students view a sheet of numerous science projects including weather, animals, flowers, and more. Students choose 1 project to do out of 22 projects total.
Curated OER
Survey Project
Eighth graders create a website using FrontPage. They use inserted forms to collect survey information and use Microsoft Excel and MS Word to create a presentation of the survey and the results.
Curated OER
Bluebirds Project
In this bluebirds project worksheet, students are given directions on completing a project about bluebirds including measurements, scientific method questions, data entry, and more. Students complete 15 exercises.
Curated OER
Canada Recycles! Do You?: Grades 4-6
In this recycling education instructional activity, students read a table regarding Canadian recycling statistics and respond to 9 questions regarding the data.
Curated OER
Squares in the Light
Students collect and analyze data using a graph. In this algebra lesson, students explain their findings orally and with a graph. They use their knowledge to solve real life scenarios.
Curated OER
Plotting Data on a Graph
Young scholars investigate graphing. For this graphing lesson, students survey the class and create graphs to reflect the data collected.
Curated OER
Graphing Data Brings Understanding
Students collect, graph and analyze data. In this statistics lesson, students use circle, pie, bar and lines to represent data. They analyze the data and make predictions bases on the scatter plots created.


