Curated OER
The Guise of a Graph Gumshoe
Eighth graders practice constructing bar, circle, and box-and-whisker graphs. They practice reading and interpreting data displays and explore how different displays of data can lead to different interpretations.
Institute for Humane Education
I've Been Branded!
How many pairs of Nikes® or Apple® products are in the average American home? What makes someone buy one particular type of laundry detergent over another? Scholars grapple with these questions as they develop a list of brands they use...
Curated OER
Slanted Surveys And Statistics
Students engage in a lesson plan that is concerned with the use of statistics and surveys and how they should be read. They create a survey and take it home to collect data. Then students display the data on a graph that is displayed in...
Curated OER
Greenhouse Gases
Although the worksheet for the lab activity is not included, this is an activating activity for your class to do when learning about the greenhouse effect. They lay three thermometers underneath a lamp: one out in the open, one under a...
Curated OER
Come On Down!
Begin with an introduction to famous deep-sea submersibles. Learners work in groups to gather information on different vessels and then share with the class. Each group then uses water displacement to help calculate the density of...
Texas Education Agency (TEA)
Developing Speed (Alpha, Numeric, and Keypad)
Hurry up! Pupils practice developing speed on a keyboard, participating in a series of drills to improve efficiency. After tracking their progress, they create an electronic guide about proper keyboarding techniques.
Curated OER
What's Your Favorite Season?
Pupils collect data on the favorite seasons. In this data collection and analysis lesson, students learn about displaying data on charts and graphs. They collect data about the favorite seasons of the children in their class and display...
Curated OER
Analysis of Grooming Behavior in Drosophila melanogaster
Young scholars engage in a lab that focuses on animal behavior in an open ended inquiry based laboratory experience. They build an ethogram, display a transition matrix and analyze a Markov Chain. They remove wings from the drosophila...
Curated OER
Data Shuffle
Middle schoolers find an advertisement or newspaper using charts or graphs. They create another graph using the same information in a different format. They write a comparison of the two graphs.
Curated OER
Matchstick Math: Using Manipulatives to Model Linear, Quadratic, and Exponential Functions
Playing with matches (unlit, of course) becomes an engaging learning experience in this fun instructional unit. Teach pupils how to apply properties of exponential functions to solve problems. They differentiate between quadratic and...
Curated OER
Linear Regression and Correlation
Learners explore scatter plots. For this linear regression lesson, groups of pupils graph scatter plots and then find the line of best fit. They identify outliers and explain the correlation. Each group summarizes and shares their...
George Washington's Mount Vernon Estate & Gardens
George Washington: Centerpiece of a Nation
A neat Presidents Day activity, this lesson provides a culminating learning experience for upper elementary aged learners. After analyzing George Washington's, "A Display of the United States of America," your learners will conduct...
Virginia Department of Education
Average Atomic Masses
Facilitate learning by using small objects to teach the principles of atomic mass in your science class. Pupils determine the average mass of varying beans as they perform a series of competitive experiments. They gather data and...
NASA
Newton Car
If a car gets heavier, it goes farther? By running an activity several times, teams experience Newton's Second Law of Motion. The teams vary the amount of weight they catapult off a wooden block car and record the distance the car...
Curated OER
When Will We Ever Use This? Predicting Using Graphs
Here are a set of graphing lessons that have a real-world business focus. Math skills include creating a scatter plot or line graph, fitting a line to a scatter plot, and making predictions. These lessons are aimed at an algebra 1 level...
Curated OER
The Golden Students
Scholars view the video, "Donald Duck in Mathmagic Land," and discuss examples in nature which have proportions of the golden ratio. They measure and record different body lengths from a worksheet and convert the ratios to equivalent...
University of Minnesota
Makes Me Sweat
Never let them see you sweat ... unless you can't help it! Scholars design an experiment to determine the effects of stress on the body. They monitor sweat production under different conditions and relate the response to the function of...
Curated OER
Buzzing is BEE-lieving
Students investigate insects. In this insect lesson, students explore various insect models and identify the characteristics of each. Students observe insects outside and tally how many insects they observe.
Curated OER
Patterns Here, There and Everywhere
Pattern recognition is a skill often used in mathematics. Learners count and sort manipulatives, organize the data into a graph and answer questions about the information displayed. They collect the objects to be used and create patterns...
Curated OER
Survey Says...
Young learners create and implement a school-wide survey about student body favorites! Learners record and analyze the data on a bar graph, picture graph, and line graph, and then display the data. Then, wrap it all up with a celebration...
Curated OER
Investigation - How Tall is the Average Sixth Grader?
Learners will measure each other and record the data in inches. They will use a stem and leaf plot to display data and figure out the average height of the students in a class. The other statistical data will be collected like the mode...
Curated OER
Probability: The Study of Chance
Students conduct an experiment, determine if a game is fair, and collect data. They interpret data, then display line graph. They conduct analysis of game for probability.
Curated OER
Application and Modeling of Standard Deviation
The first activity in this resource has learners computing the mean and standard deviation of two different data sets and drawing conclusions based on their results. The second activity has them using a dice-rolling simulation to...
Curated OER
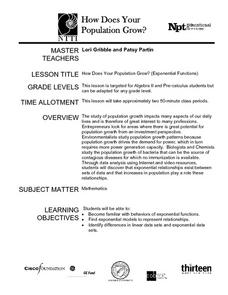
How Does Your Population Grown?
Do you know how the population has grown of your community? Can you predict the population over the next half century? Can we find an algebraic model that matches our data? These along with many more questions can be researched by...
Other popular searches
- Data Display
- Misleading Data Display
- Appropriate Data Display
- Graphs and Data Display
- Display Simple Data
- Analyze Data Displays
- Data Display Center
- Voluntary Data Display
- Best Data Display
- Rates and Data Display
- Simulation Data Display
- Ways to Display Data


