Curated OER
Relating Number of Insect Species to Water Quality
Students are asked to respond to questions such as:" Have there been surveys of the area to inventory the species?" (For example, for a wetland area, do they know what amphibians live there and how abundant they are?) Are there any...
Curated OER
A Journey To Africa: Art And Artifacts
Learners create a multimedia presentation based on a piece of African Art. They use the art piece to demonstrate the culture and ceremonies of the area in which it was produced. They research facts for a Power Point, write a poem...
Curated OER
Construct with Solids
Students discover which properties of solids lend themselves to building a tower through hands on trial and error and observation of others as they are building. They write down the steps it took them to build the tower and label an...
Curated OER
Women's Roles: Then and Now
Fourth graders investigate women's roles during the frontier era in what is today's West Virginia. In this US history lesson, 4th graders discuss similarities and differences of women's roles in the past with what women's roles are in...
Curated OER
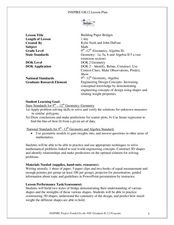
Building Paper Bridges
Students construct a bridge that can hold 100 pennies. In this math lesson, students evaluate the strength of their bridges. They predict how much weight a bridge can hold based on its design.
Curated OER
Ecology: Adaptations
Eighth graders identify different types of adaptation in organisms. In this biology lesson, 8th graders explain how adaptation help organisms survive. They complete a worksheet at the end of the lesson.
Google
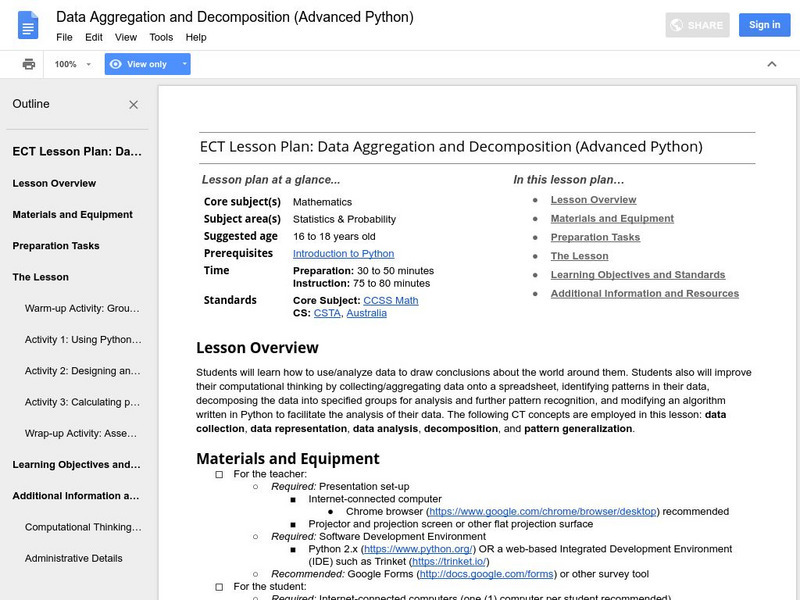
Google for Education: Data Aggregation and Decomposition (Python)
Students learn how to use and analyze data to draw conclusions about information collected from classmates. Then they use computational thinking by collecting and aggregating data onto a spreadsheet, identifying patterns in their data,...
Science Education Resource Center at Carleton College
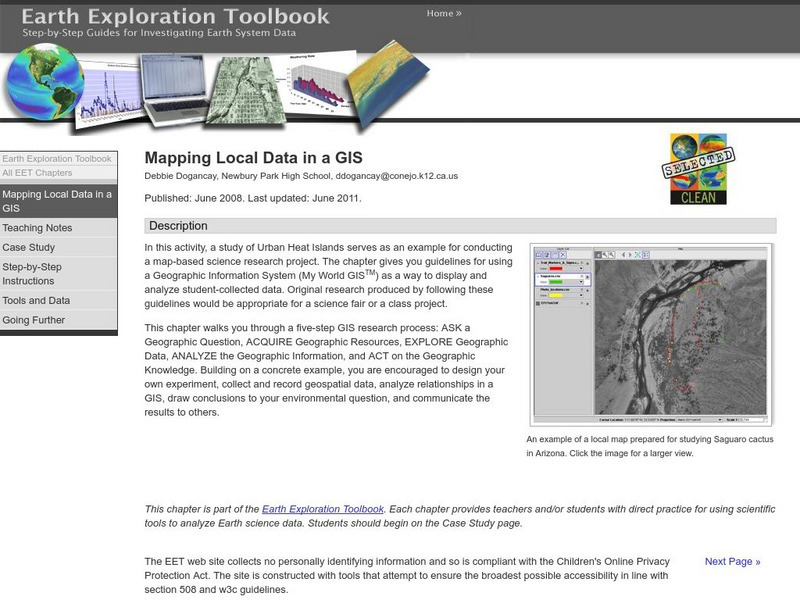
Serc: Mapping Local Data in a Gis
In this activity, students will learn how to conduct a map-based science research project using a Geographic Information System (GIS). They will design an experiment, collect and record geospatial data, analyze geospatial relationships...
Google
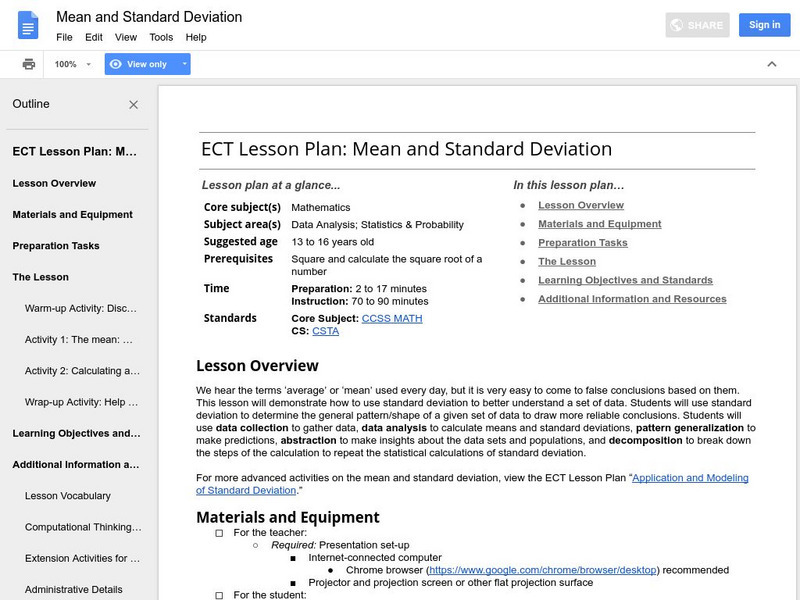
Google for Education: Mean and Standard Deviation
This lesson demonstrates to learners how to use standard deviation to better understand a set of data. Students use standard deviation to determine the general pattern or shape of a given set of data to draw more reliable conclusions.
BioEd Online
Bio Ed Online: Balloon Blast
In the following lesson students are asked to devise a plan to measure the distance of a balloon's flight, predict the direction a balloon will travel as it deflates, learn about Newton's Laws of Motion, experience Newton's Third Law,...
Songs for Teaching
Songs for Teaching: Scientific Method Blues
This lesson introduces the scientific method to your students through song. Students will learn the steps of the scientific method through this great song written by Kathleen Carroll. Click on the link and play it for your whole class.
Science Education Resource Center at Carleton College
Serc: Investigating the Magnetic Force Field: Calculating Magnetic Pull
In this classroom activity, the students will investigate the magnetic pull of a bar magnet at varying distances with the use of paper clips. Students will hypothesize, conduct the experiment, collect the data, and draw conclusions that...
Louisiana Department of Education
Louisiana Doe: Louisiana Believes: English Language Arts: Grade 6: If Stones Could Speak
Sixth graders will explore history and will learn that archaeologists, like detectives, work to piece together the past through investigation. Archaeological research provides us with stories of human history that help us understand the...
Illustrative Mathematics
Illustrative Mathematics: F Bf 1,000 Is Half of 2,000
This task is about an online mathematics organization that is trying, over a four-year period, to generate 2,000 math problems that cover all grades. This real-life modeling task could serve as a summative exercise that draws on many...
Science Education Resource Center at Carleton College
Serc: How Wind Affects Various Objects
For this activity, young scholars experiment with various objects in a wind tunnel. Together, they record predictions and data in a class data table. Students will then use the information gained in the experiment to draw conclusions...
PBS
Pbs: The Roman Empire of the 1st Century: Mapping an Empire
In this instructional activity, students will compare a map of the Roman Empire in 44 BC with one of the Roman Empire in 116 AD. Using these two maps as a reference, students will use critical reading skills to learn about the expansion...
Science Education Resource Center at Carleton College
Serc: Investigating Factors Influencing Rates of Chemical Reactions
This lab investigates the factors that influence rates of reactions. Learners will develop a hypothesis, test the hypothesis, collect data, then draw a conclusion based on the data.
Science Education Resource Center at Carleton College
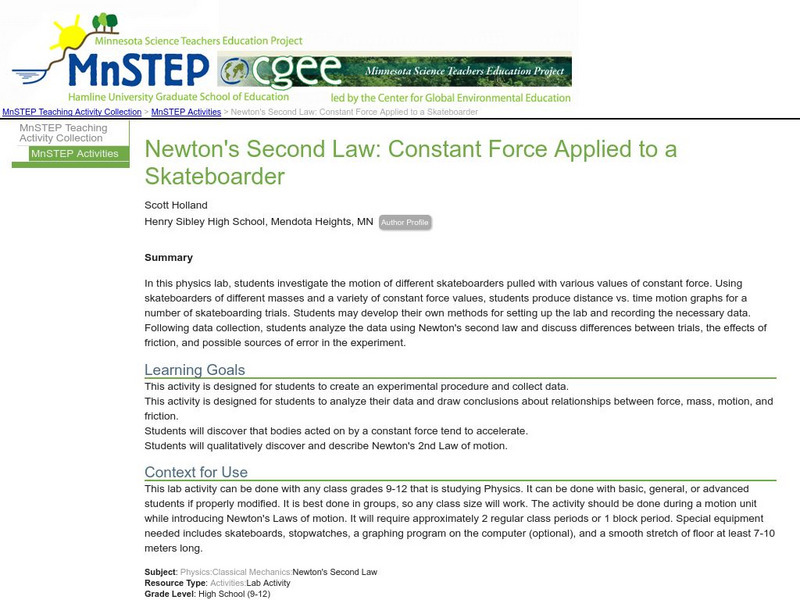
Serc: Newton's Second Law: Constant Force Applied to a Skateboarder
In this lab activity, students will become familiar with Newton's 2nd Law of Motion. By investigating the motion of different skateboarders pulled with a variety of constant force values, they will discover that bodies acted on by a...
Science Education Resource Center at Carleton College
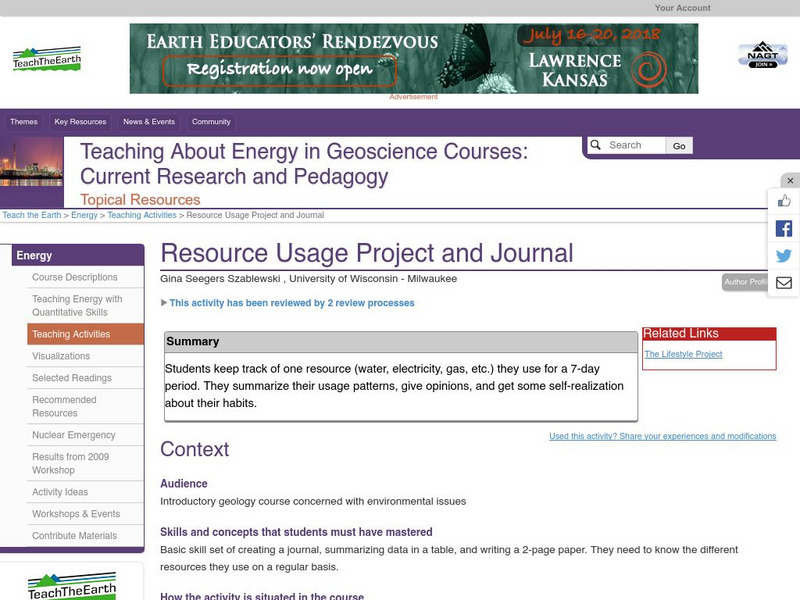
Serc: Resource Usage Project and Journal
Students pick a resource and track their use of it over the course of one week. Students record their data in a spreadsheet, write a summary of it, and draw conclusions from their usage patterns. A detailed student handout is provided.
Michigan State University
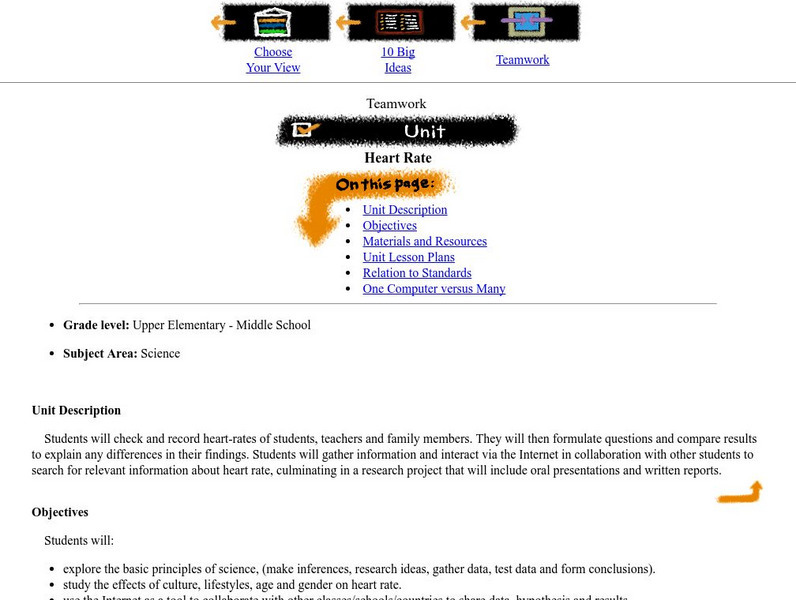
Michigan State University: Lets Net: Heart Rate
In this experiment, students will compare heart-rates of classmates and family member to draw conclusions about their data. Students can collect data and collaborate with others on the Internet to broaden their sample size. Lesson...


