The Math League
The Math League: Using Data and Statistics
This site contains two short examples of line graphs, charts that show change over time. This is a quick introduction to the topic of statistical graphing.
Scholastic
Scholastic: Bars, Lines, and Pies
Young scholars will learn and reinforce skills for creating, applying and analyzing pie charts, bar graphs and line graphs.
Texas Instruments
Texas Instruments: Mc Dougal Littell Middle School Math: Making Data Displays
Students will create data displays using a scatter plot and a line graph of the data and a circle graph of survey data.
Math Is Fun
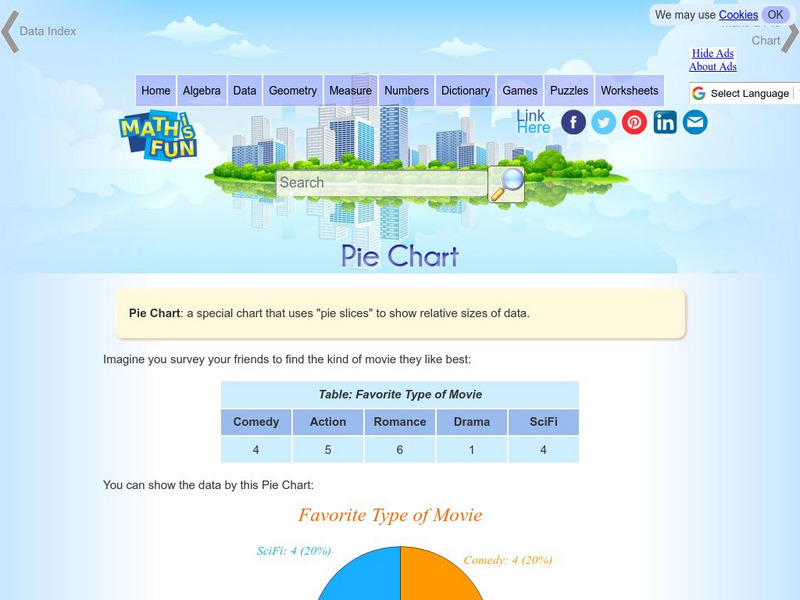
Math Is Fun: Pie Chart
Explains, with examples, what a pie chart is and how to make one. Includes a set of practice questions.
PBS
Pbs Kids Afterschool Adventure!: Operation: All About Us Activity Plan
It's time to stand in the spotlight! During this Afterschool Adventure, children will learn about and practice a variety of math skills as they gather information about their favorite subject-themselves! Children will start out by...
Primary Resources
Primary Resources: Line Graphs and Pie Charts
Here are a few resources to use with your students when teaching about line graphs or pie charts.
ClassFlow
Class Flow: Interpreting Tables and Graphs
[Free Registration/Login Required] Explore a variety of graphs and tables. Many activities are incorporated to provide practice solving problems using different graphs and charts.
Khan Academy
Khan Academy: Creating Frequency Tables
Practice creating frequency tables from small data sets. Students receive immediate feedback and have the opportunity to try questions repeatedly, watch a video or receive hints.
TeacherLED
Teacher Led Interactive Whiteboard Resource Survey
Students can explore surveys, pie charts, and bar graphs with this interactive white board resource.
Khan Academy
Khan Academy: Creating Dot Plots
Practice creating dot plots. Dot plots are very similar to frequency tables, but they make it easier to see the data. Students receive immediate feedback and have the opportunity to try questions repeatedly, watch a video or receive hints.
Wolfram Research
Wolfram Math World: Pie Chart
This page briefly discusses the use of pie charts (or circle graphs) in representing data. Provides detailed information for understanding.
PBS
Pbs Kids Afterschool Adventure!: Operation: Martha's Stem Stories Activity Plan
Welcome to Martha's STEM Stories! STEM stands for science, technology, engineering, and mathematics. You may already know that doing STEM means testing ideas, collecting data, making calculations, and drawing graphs and charts-but you...
University of Cambridge
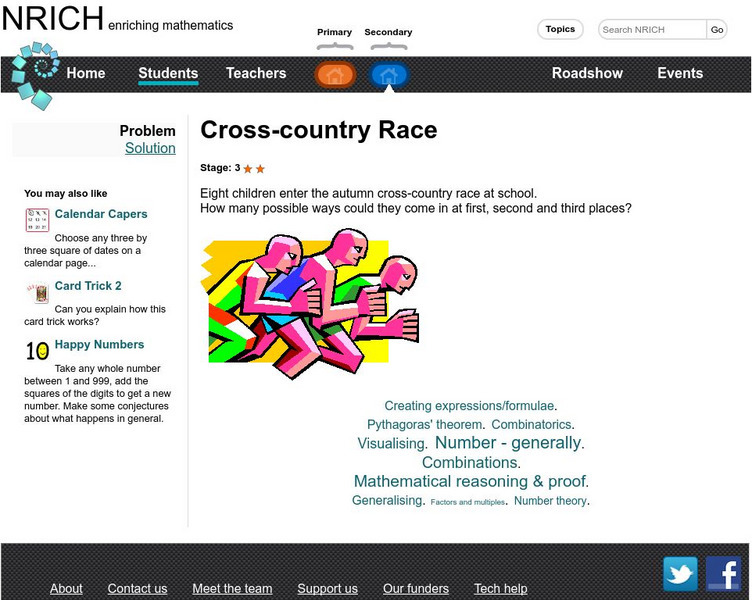
University of Cambridge: Nrich: Cross Country Race
On this one page website sharpen your logic and problem solving skills while working on this challenge. The solution is available to double check your solution.
Teachnology
Teachnology: Survey Teaching Theme
Survey Theme provides an excellent collection of free sample worksheets, teacher resources, lesson plans and interactive media for grades k-12.
Teachnology
Teachnology: Survey Teaching Theme
Survey Theme provides an excellent collection of free sample worksheets, teacher resources, lesson plans and interactive media for grades k-12.
Khan Academy
Khan Academy: Reading Dot Plots & Frequency Tables
Practice reading basic dot plots and frequency tables. Students receive immediate feedback and have the opportunity to try questions repeatedly, watch a video or receive hints.
Khan Academy
Khan Academy: Creating Frequency Tables
In this exercise, students practice creating frequency tables. Students receive immediate feedback and have the opportunity to get hints and try questions repeatedly.
Khan Academy
Khan Academy: Create Histograms
Practice creating histograms. Students receive immediate feedback and have the opportunity to try questions repeatedly, watch a video or receive hints.


