Texas State Energy Conservation Office
Investigation: Kinetic and Potential Energy
A well-developed lab sheet guides physical science learners through an investigation of kinetic and potential energy. In small groups, collaborators discover whether or not the ramp height or mass of an object has an effect on the...
Wild BC
The Greenhouse Effect: Warming the Earth Experiment
First in a two-part lesson on the greenhouse effect, this lesson involves a classroom demonstration of the phenomenon, and a lab group experiment with color and absorption. Although there are easier ways to demonstrate the greenhouse...
Curated OER
Modeling Linear Relationships
Young scholars graph lines using the slope and y-intercept. In this algebra lesson, students create data using tables and equations. They use their data to make predictions and draw conclusion.
Curated OER
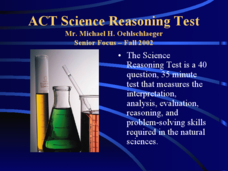
ACT Science Reasoning Test
The types of scientific information that need to be analyzed in the ACT test are presented here. Tips and techniques for completing the research, data, viewpoints, and multiple choice questions will help your class and their expectations.
Curated OER
Hypothesis Testing
Learners investigate the finding of a hypothesis and how it can be tested.For the experiment they will be using the concept of probability. Students design an experiment and test the hypothesis. Then the results are graphed showing the...
Curated OER
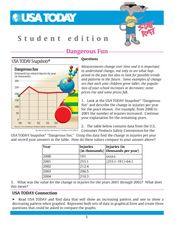
Dangerous Fun
In this line graph worksheet, students analyze the data on a graph about toy-related injuries by year. Students solve 5 problems in which the change in injuries per year is calculated and recorded on a table.
Curated OER
Introduction to Graphical Representation of Data Sets in Connection with Nuclear Decay
Students record data, make observations, and share in experimentation and discussion of numerical experiments.
Curated OER
Kansas Foods A Data and Probability Investigation
Students study a number of food products and anticipate which are derived from Kansas crops. They make a list of words associated with the food stuffs and graph the results.
Curated OER
Graphing Current Drug Data
Students increase understanding of the drug issue and further develop skill in graphing.
Curated OER
Lines of Fit
Students graph an equation and analyze the data. In this algebra lesson plan, students graph scatter plots and identify the line of best fit using positive correlation, negative correlation an d no correlation. They apply their data...
Curated OER
Graphing Favorite Holidays
Students create spreadsheets and bar graphs based on results of survey of favorite holidays.
Curated OER
Analyzing Health
Third graders analyze their health. In this analysis lesson plan, 3rd graders rate their health on a 1-10 scale. They then tally the scores from the class and create a data chart. Then they answer true and false questions based on...
Curated OER
Spaghetti Bridges: Student Worksheet
Here is a wonderful activity that allows young engineers to try their hand at designing a bridge out of spaghetti! The learning exercise explains the activity and also provides a graph for keeping track of the results. Very good!
Curated OER
Michigan Virtual Field Trip
Students analyze data from a virtual field trip to Michigan. They conduct Internet research on mileage and travel time between cities, calculate and compare fuel costs, and research and calculate lodging, activities, and meal costs.
Curated OER
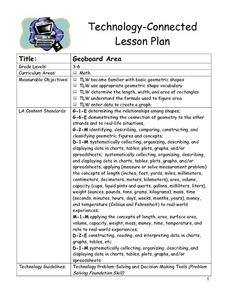
Geoboard Area
Students explore the basic geometric shapes and geometric shape vocabulary through the use of geoboards and virtual geoboards. They create a variety of shapes with a partner, build ten different rectangles on their geoboards, and...
Curated OER
An Inventory of My Traits
In this biology activity, students identify and describe a number of easily observable genetic traits and compare the traits they have with other students. Then they identify and describe that some traits are common while others are not...
Curated OER
Count The Letters
Students perform activities involving ratios, proportions and percents. Given a newspaper article, groups of students count the number of letters in a given area. They use calculators and data collected to construct a pie chart and bar...
Curated OER
Statistics with State Names
Students analyze the number of times each letter in the alphabet is used in the names of the states. In this statistics lesson, students create a stem and leaf plot, box and whisker plot and a histogram to analyze their data.
Curated OER
Survey and Tally
Second graders view a model of a survey and tally. In this survey and tally lesson plan, 2nd graders decide on questions for a survey. Students conduct the survey and tally their results. Students create a tally chart. Students view a...
Curated OER
You Light Up My Life
Students examine the relationship between solar activity and the Earth's geomagnetic field in producing the phenomena known as aurora borealis (Northern Lights) by reading and discussing "Earth, Wind and Fireworks." students graph data...
Curated OER
Energy and Changes of State
Students complete a variety of labs to help them explain how energy affects the changes in states of matter. They also be required to collect and record data, graph data, and apply interpretations of that data.
Curated OER
Acceleration 2
In this acceleration worksheet, students experiment with varying amounts of mass to observe the effects on the force needed to move an object. Students apply Newton's Second Law of Motion to describe the relationship between mass and...
Curated OER
Probabilities for Number Cubes
Learners explore the concept of probability. In this probability lesson, students roll a six-sided number cube and record the frequency of each outcome. Learners graph their data using a frequency chart and keep tally marks in a...
Curated OER
Probability
In this probability worksheet, students determine the empirical probability based on specific sample data. The one page worksheet contains three problems. Solutions are provided.


