Inside Mathematics
Scatter Diagram
It is positive that how one performs on the first test relates to their performance on the second test. The three-question assessment has class members read and analyze a scatter plot of test scores. They must determine whether...
Kenan Fellows
Density
Most scholars associate density with floating, but how do scientists determine the exact density of an unknown liquid? The third lesson in a seven-part series challenges scholars to find the mass and volume of two unknown liquids. Each...
Virginia Department of Education
Exponential Modeling
Investigate exponential growth and decay. A set of six activities has pupils collecting and researching data in a variety of situations involving exponential relationships. They model these situations with exponential functions and solve...
Statistics Education Web
Using Dice to Introduce Sampling Distributions
Investigate the meaning of a sample proportion using this hands-on activity. Scholars collect data and realize that the larger the sample size the more closely the data resembles a normal distribution. They compare the sample proportion...
Charleston School District
Increasing, Decreasing, Max, and Min
Roller coaster cars traveling along a graph create quite a story! The lesson analyzes both linear and non-linear graphs. Learners determine the intervals that a graph is increasing and/or decreasing and to locate maximum and/or minimum...
Curated OER
Cosmic Chemistry: An Elemental Question
Space scientists investigate the cosmic phenomena in order to search for answers to possible origins of the solar system. They consider the concepts of elements and isotopes. Data is analyzed looking at tje abundance of elements...
Curated OER
TE Activity: Bubbling Plants
Students study a way to quantify the process of photosynthesis during a given time using the Elodea plant. They design a hypothesis that they test in the hands on activity. They compare the amounts of photosynthesis that occur during low...
Curated OER
Algebra I: Linear Functions
Using rates from a rental car company, young mathematicians graph data, explore linear relationships, and discuss the role of slope and the y-intercept. This lesson allows for the discussion of independent and dependent variables, as...
It's About Time
Mass Extinction and Fossil Records
The focus of a fossil-based lesson uses graphs and charts that allow young paleontologists to make inferences about events of mass extinction. They must apply their previous knowledge about fossil records in this final lesson of the...
PHET
Soda Bottle Magnetometer
Introduce learners to set of complete instructions that describe how to build a magnetometer that works just like the ones professional photographers use to predict auroras. The diagrams are wonderfully descriptive, and the written...
Nuffield Foundation
Intrepreting Information about Sweating and Temperature
Why do we sweat? Scholars analyze data about body temperature, sweating, and other factors to better understand sweating. They note the changes after drinking ice water to sweating, skin temperature, and body temperature. Analysis...
Statistics Education Web
The Egg Roulette Game
Hard boiled or raw? Which egg will you get? A hands-on activity has scholars explore the impact of conditional probability. Based on a skit from the Tonight Show, pupils model the selection of the two types of eggs using beads. They...
NOAA
El Niño
El Nino, La Nina ... and the Santa Maria? The 11th installment of a 23-part NOAA Enrichment in Marine sciences and Oceanography (NEMO) program explains the mechanism of El Nino/Southern Oscillation. Pupils use previous data to determine...
Virginia Department of Education
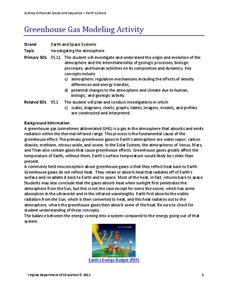
Greenhouse Gas Modeling Activity
Why are greenhouse gases called greenhouse gases? Young Earth scientists learn about greenhouse gases though experimentation in the second installment of a 3-part series. They use lamps to model radiant energy as well as warming through...
Curated OER
The "U's" Have IT!
Students explore the maximum and minimum values of parabola. In this exponential equations lesson, students use graphing calculators or TI Interactive Software to calculate values of parabola and graph x-intercepts of parabola.
University of Georgia
Heating and Cooling of Land Forms
Compare heating and cooling rates of different land forms. A lab activity has groups collect data on the rate of heating and cooling of soil, grass, saltwater, fresh water, and sand. An analysis of the rates shows how the different land...
NASA
Development of a Model: Analyzing Elemental Abundance
How do scientists identify which elements originate from meteorites? Scholars learn about a sample of material found in a remote location, analyzing the sample to determine if it might be from Earth or not. They study elements, isotopes,...
Curated OER
Changing Planet: Sea Levels Rising
Begin by showing a six-minute video, Changing Planet: Rising Sea Level as an anticipatory set. Pupils draw a topographic map of a potato continent. Finally, they will visit NOAA's sea levels online map and NASA's carbon dioxide...
Curated OER
Getting to Know You
Students converse with each other while playing a game in order to discover things that are alike and things that are different about themselves. The students gather data about themselves, organize and display data on the graph, and...
Curated OER
Snow Cover By Latitude
Students examine computerized data maps in order to create graphs of the amount of snowfall found at certain latitudes by date. Then they compare the graphs and the data they represent. Students present an analysis of the graphs.
Curated OER
Mean, Median, and Mode
Students calculate the mean, median, and mode in a set of numbers. In this data analysis lesson, students put a set of numbers in ascending order and perform calculations to find the mean, median, and mode.
Curated OER
What Pie?
Students practice making and interpreting pie graphs so they are better able to decide if a pie chart is the appropriate form of display. Students examine included overheads of different pie charts, and directions on how to make pie...
Curated OER
Real Estate Lesson: Monthly Payments
Pupils examine real-world data relating to real estate. They conduct Internet research, record data regarding real estate in major cities, graph the data, calculate mortgage payments using a mortgage calculator, and analyze the data.
Curated OER
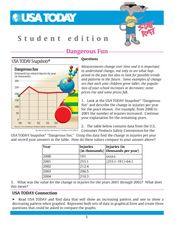
Dangerous Fun
In this line graph worksheet, students analyze the data on a graph about toy-related injuries by year. Students solve 5 problems in which the change in injuries per year is calculated and recorded on a table.


