Curated OER
Energy Efficient Homes
Students observe and gather data from a model simulated home. In this efficiency lesson students examine the factors that influence energy efficiency, complete a lab activity then draw conclusions from their data.
Curated OER
Steppin' Out
Students are presented with the question: "Do longer legged people run faster than shorter legged people?" Students conduct an experiment, collect their data, create box and whisker plots using a computer and graphing program, and...
Curated OER
Animal Skin
Students investigate the skin surface to body area ratios for different animals. In this seventh/eighth grade mathematics/science lesson, students explore heat transfer between an animal’s body and the environment. Using technology,...
Curated OER
Osmosis and the Cell Membrane-part 2
Young scholars participate in a review of diffusion and the basic properties of the cell membrane before exploring the process of osmosis in a lab activity. Using shell-less eggs that have soaked in various solutions, students make...
Howard Hughes Medical Institute
Survival of the Fittest - Variations in the Clam Species Clamys sweetus
It's not often that you come across a clever laboratory activity that is both imaginative and comprehensive! Using M&M's and Reese's peanut butter candies to represent two different clam species, young biologists test for "relative...
Curated OER
Observing and Recording Biological Data
Learners create their own definition of life. They identify the eight characteristics of life in organisms. They compare and contrast the characteristics of living and nonliving things.
Florida Department of Health
Understanding the Risk of Substance Abuse Unit
Teenage brains are different! Understanding that the teenage brain is still developing and thus more impacted by substance abuse is the key concept in a three-lesson high school health unit. Participants learn about how the brain and...
Curated OER
It's Your Life - Safe or Sorry/Safety Issues
Students examine and chart data about safety hazards and unsafe situations. In this safety hazard lesson, students examine newspapers and web sites to investigate injuries from safety hazards. They make a spreadsheet using the data and...
Curated OER
Mystery Jars
This is a twist on the old "guess how many jellybeans" game. Using estimation and math skills, learners participate in a fun "mystery jars" activity, trying to make educated guesses at how many objects are in two jars. The basic activity...
University of Connecticut
Building Your Own Biosphere
On September 26, 1991, four women and four men entered the scientific experiment, Biosphere 2; the doors were sealed for two years in order to study the interactions of a biosphere. In the activity, scholars explore biospheres by...
EngageNY
Estimating Probability Distributions Empirically 2
Develop probability distributions from simulations. Young mathematicians use simulations to collect data. They use the data to draw graphs of probability distributions for the random variable in question.
Howard Hughes Medical Institute
Beaks as Tools: Selective Advantage in Changing Environments
How does nature select some adaptations over others? Scholars experiment picking up seeds with two different types of tools simulating beaks. After practicing, they experience a drought where one type of seed suddenly isn't available....
Curated OER
Patterns Here, There and Everywhere
Pattern recognition is a skill often used in mathematics. Learners count and sort manipulatives, organize the data into a graph and answer questions about the information displayed. They collect the objects to be used and create patterns...
Curated OER
Graphing Memories
Mem Fox’s Wilfrid Gordon McDonald Partridge provides the labels for a graphing activity. Class members create an illustration of a memory item brought from home, and place their illustration in the proper column of a graph. When the...
Curated OER
Simplified Vertical Rebound Testing
Learners participate in a lab activity in which they examine a simple energy transformation system. Students test the rebound of elastomers, produce rebound data, and determine the kinetic energy transformed by the impact of a free...
Pennsylvania Department of Education
Multiplication Represented as Arrays
Third graders collect data about themselves and use in a line plot. In this analyzing data instructional activity, 3rd graders collect various sets of information,create a line plot and compare the data. Students complete a worksheet on...
Curated OER
Ink Analysis and Thin Layer Chromatography
Students explain the process of TLC. They identify at least three components of ink. They analyze data and make conclusions based on laboratory observations.
Curated OER
Excel for Beginners
In this Excel lesson, learners set a formula to check their homework. Students also use clipart, work in groups, and learn to use the tools in the drop-down list.
Curated OER
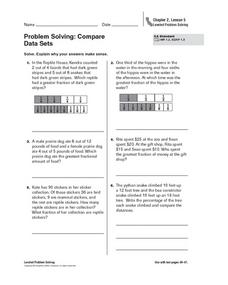
Problem Solving: Compare Data Sets
There are a variety of techniques students can use to compare fractions. In this worksheet on fractions, 5th graders are shown a way to create a visual comparison and asked to solve word problems. Students are encouraged to draw a...
National Security Agency
Are You Ready to Call the Guinness Book of Records?
Learners design questions that can be answered by collecting data. In this line-plot lesson, pupils collect data and graph on a line plot on world records. An abundant supply of teacher support is provided in this resource.
Curated OER
Project Geode
Young geologists attempt to predict the appearnace of a geode's internal structure based on how it looks from the outside, its mass, and its physical characteristics. In this geologly instructional activity, learners use scientific...
Discovery Education
Mood Music!
Grouchy? Sad? Here's a great resource that shows kids how music can be used to lift their spirits. Kids collect and chart data on the effects of music on emotions. After analyzing the results of their experiment, they develop their own...
Curated OER
Mystery Liquids: Linear Function
High schoolers determine the linear equations of the density of water and oil by collecting data on the mass of various volumes of each liquid. They construct scatter plots from the data and use these to write the linear equations for...
Kenan Fellows
Sensors in Chemistry
The Environmental Protection Agency monitors sensors to track air pollution and set clean air standards. Enthusiastic young scientists use similar sensors to gather data in their area and then apply the gas laws and conservation of...


