BioEd Online
Good Stress for Your Body
Stress the importance of the different types of pressure our mind and body experience in a lesson about how certain types of stress are actually necessary and good for our bodies. As astronauts and people with injuries can attest, not...
Curated OER
Greenhouse Gases
Although the worksheet for the lab activity is not included, this is an activating activity for your class to do when learning about the greenhouse effect. They lay three thermometers underneath a lamp: one out in the open, one under a...
Curated OER
Developing the Concept: Rates
Learners discover how to use the knowledge of unit rates to understand equivalent ratios and solve real-world problems. They are given word problems to solve using equivalent ratios. Tables are also covered in this resource.
Curated OER
Catches and landed value of fish
Students analyze data. In this secondary mathematics lesson, students read and retrieve data from a statistical table on the Canadian fishing industry. Students interpret and describe data in mathematical terms and make...
Curated OER
Bar Graphs
Seventh graders visually represent and analyze data using a frequency table. They recognize what values in a data set are bigger by looking at a bar graph and answer questions about certain bar graphs and what they represent. Students...
Curated OER
Chinese Immigrants in British Columbia, 1870
Students interpret historical evidence presented in primary and secondary resources. In this British Columbia history lesson plan, students read and analyze data regarding 1870 Canadian census data....
Curated OER
Discovering Pi
Students develop a formula that describes the functional relationship of the circumference of a circle to its diameter. Working with a partner, they measure the diameter and circumference of circular objects in order to discover the...
Curated OER
The Fat and the Lean
Students collect data on calorie intake. In this algebra lesson plan, students use the collection of data to make better eating decisions. They investigate the nutritional value in food using a graph and draw conclusion from their findings.
Curated OER
Color Tile Graphing
Students explore data. They gather data and generate questions about the data in pictographs, tallies, tables, and bar graphs. Students use color tiles pulled by random to create their own bar graph. They discuss the bar graphs they...
Curated OER
Role-Playing Jean Talon
Students explore New France. In this New France lesson plan, students examine census data compiled by Jean Talon in 1665 and 1666. Students take on the role of Talon trying to convince the King of France to increase his investment in...
Curated OER
Misleading Graphs
Students explore number relationships by participating in a data collection activity. In this statistics lesson, students participate in a role-play activitiy in which they own a scrap material storefront that must replenish its...
Curated OER
Graphing in the Information Age
Students create a variety of graphs based on population data. In this statistics lesson, students use data that can be gathered on-line to make a bar chart, line graph, and circle graph.
Curated OER
Our Favorites
Young scholars participate in and conduct a survey to determine various class favorites. They collect, organize and display their data, interpret the results, and complete a packet of worksheets to display the information.
Curated OER
Canada's Climate: Temperature and Rainfall Variations
Students analyze data about various climates in Canada. In this data analysis and climate lesson, students use Canada Year Book 1999 to complete a worksheet and make connections between precipitation and temperature in different climates.
Curated OER
Creating Line Graphs
High schoolers draw line graphs. In this math instructional activity, students interpret minimum wage data and graph the data in a line graph. High schoolers predict the next minimum wage and figure the earnings for a 40 hour work week...
Curated OER
Local Traffic Survey
Students conduct a traffic survey and interpret their data and use graphs and charts to display their results.
Curated OER
Power Metering Project
Students collect and analyze variable data and understand the concept of electrical power. In this energy lesson students use a spreadsheet to manage their data and create box plots.
Curated OER
Ocean Temperatures
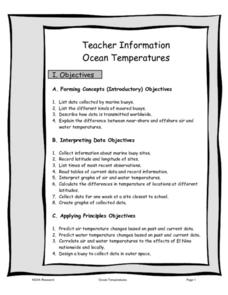
Young scholars list data collected by marine buoys and the different kinds of moored buoys. They describe how data is transmitted worldwide. They explain the difference between near shore and offshore air and water temperatures.
Curated OER
The Human Line Plot
Fifth graders collect data and use charts and line plots to graph data. Through class surveys, 5th graders collect data concerning a particular subject. They graph their data using a line graph. Students make inferences and predictions...
Curated OER
Getting A Grip On Graphs
Fourth graders investigate the concept of graphing and comparing different types of data using pictographs, line graphs, scatter plots, etc... They gather data and make interpretations while examining the medium of how it is displayed.
Curated OER
Patterns, Relations, and Functions
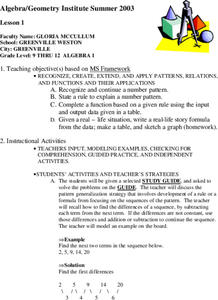
Students investigate the patterns of different data sets of numbers. They use critical thinking skills in order to find the missing numbers in any given set. This lesson helps to develop the skill of number sense.
Curated OER
Bias in Statistics
Students work to develop surveys and collect data. They display the data using circle graphs, histograms, box and whisker plots, and scatter plots. Students use multimedia tools to develop a visual presentation to display their data.
Curated OER
Olympic Line Graphs
Sixth graders examine how to make line graphs. In this Olympic line graph lesson students make line graphs and search the given Internet sites to find data on their summer Olympic Game.
Curated OER
Temperature Bar Graph
Learners explore mean, median and mode. For this math lesson, students analyze temperature data and figure the mean, median, and mode of the data. Learners graph the data in a bar graph.
Other popular searches
- Data Tables
- Data Displays
- Displaying Data
- Create Data Table
- Data Table and Graph
- Creating Data Tables
- Science Data Tables
- Creating a Data Table
- Making Data Tables
- Organizing Data in Tables
- Solar System Data Table
- Data Tables and Graphing


