Curated OER
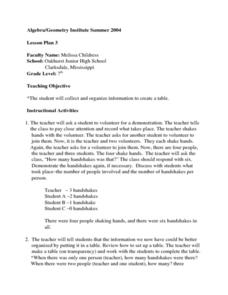
Creating a Data Table
Seventh graders explore organizing data into a table. The teacher leads a handshaking activity among the class. They collect the information concerning the number of handshakes each person received. Students discover a pattern. They...
Inside Mathematics
Snakes
Get a line on the snakes. The assessment task requires the class to determine the species of unknown snakes based upon collected data. Individuals analyze two scatter plots and determine the most likely species for five additional data...
Shmoop
Box, Stem-Leaf, and Histogram
A helpful and versatile worksheet requires young mathematicians to analyze data in order to create graphs and answer questions. Additionally, it prompts learners to find the mean, median, mode, and range of some of the data sets.
Workforce Solutions
30 Seconds
Thirty seconds are all scholars have to develop an engaging commercial to showcase their talents and experience within a specific occupation. Pairs work collaboratively to keep each other on time to deliver information speedily and ask...
Bowland
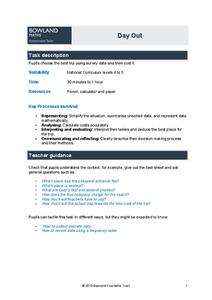
Day Out
Use mathematics to help plan a field trip. Scholars use the results of a survey to determine where a class should go on a field trip. They use provided data about entrance fees and mileage to calculate the cost per person of such a trip.
Inside Mathematics
House Prices
Mortgages, payments, and wages correlate with each other. The short assessment presents scatter plots for young mathematicians to interpret. Class members interpret the scatter plots of price versus payment and wage versus payment for...
National Security Agency
Starting a Restaurant
Through an engaging unit, chefs-in-training will sort and classify data using tally charts. Learners will also create bar graphs to display restaurant data and interpret data from bar graphs using a variety of categories. This is a fun...
Curated OER
Flicking Football Fun
Young mathematicians fold and flick their way to a deeper understanding of statistics with a fun, hands-on math unit. Over the course of four lessons, students use paper footballs to generate data as they learn how to create line...
Bowland
Mystery Tours – Plan Your Tour
Everyone loves a vacation and a set of three activities has groups planning a tour of the U.K. using given distance, time, and price data. They solve a variety of problems related to the trip and produce a report on the success of the trip.
Statistics Education Web
The Case of the Careless Zookeeper
Herbivores and carnivores just don't get along. Using a box of animal crackers, classes collect data about the injury status of herbivores and carnivores in the box. They complete the process of chi-square testing on the data from...
EngageNY
Connecting Graphical Representations and Numerical Summaries
Which graph belongs to which summary statistics? Class members build upon their knowledge of data displays and numerical summaries to connect the two. Pupils make connections between different graphical displays of the same data in the...
Noyce Foundation
Granny’s Balloon Trip
Take flight with a fun activity focused on graphing data on a coordinate plane. As learners study the data for Granny's hot-air balloon trip, including the time of day and the distance of the balloon from the ground, they practice...
University of Georgia
Using Freezing-Point Depression to Find Molecular Weight
Explore the mathematical relationship between a solvent and solute. Learners use technology to measure the cooling patterns of a solvent with varying concentrations of solute. Through an analysis of the data, pupils realize that the rate...
Willow Tree
Line Graphs
Some data just doesn't follow a straight path. Learners use line graphs to represent data that changes over time. They use the graphs to analyze the data and make conclusions.
Radford University
A Change in the Weather
Explore the power of mathematics through this two-week statistics unit. Pupils learn about several climate-related issues and complete surveys that communicate their perceptions. They graph both univariate and bivariate data and use...
Saxon
Plotting Functions
Youngsters use a graphing calculator to assist in creating a function table. They graph the function on a coordinate plane. They explore the relationship between the domain and range in the graph. This four-page worksheet contains two...
Bowland
Speed Cameras
Do speed cameras help reduce accidents? Scholars investigate this question using a series of spreadsheet activities. Along the way, they learn about randomness, probability, and statistical analysis.
Virginia Department of Education
Graphs
Examine different types of graphs as a means for analyzing data. Math scholars identify the type of graph from a series of data displays and then develop questions to match each one. Then, given a scatter plot of height versus age data,...
Curated OER
How Fast is it Traveling?
Learners calculate the rate of speed of various moving objects within the classroom setting, or outside under a controlled environment.
Curated OER
Using Random Sampling to Draw Inferences
Emerging statisticians develop the ability to make inferences from sample data while also working on proportional relationships in general. Here, young learners examine samples for bias, and then use random samples to make inferences...
Math Worksheets Land
Pie or Circle Graphs - Guided Lesson
A guided lesson worksheet reinforces pie graph skills using a given set of data. Each problem requires young mathematicians to create a circle graph using five colors, and to provide a key that goes along with the graph.
Illustrative Mathematics
Modeling London's Population
Looking at London's population from 1801–1961 in 20 year increments, high school mathematicians determine if the data can be modeled by a given logistic growth equation. They explain their thinking and determine the values of each...
Pingry School
Heat of Reaction and Hess's Law
Melting and burning might seem like opposites, but both exist as common examples of exothermic reactions. Scholars work with three different exothermic chemical reactions to determine the enthalpy changes. They measure and mix chemicals,...
EngageNY
End-of-Module Assessment Task: Grade 8 Module 6
Test your knowledge of linear functions and models. The last installment of a 16-part module is an end-of-module assessment task. Pupils solve multi-part problems on bivariate data based on real-world situations to review concepts from...
Other popular searches
- Data Tables
- Data Displays
- Displaying Data
- Create Data Table
- Data Table and Graph
- Creating Data Tables
- Science Data Tables
- Creating a Data Table
- Making Data Tables
- Organizing Data in Tables
- Solar System Data Table
- Data Tables and Graphing


