Curated OER
Matrices: A Secret Weapon
Students perform operations with matrices. In this algebra lesson plan, students use cryptography and cryptanalysis to solve problems. They add, subtract, and multiply matrices.
Curated OER
Add and Subtract with Hudson River shipping
Rivers aren't just a place for animals to live, they also provide industrial transportation. The class will examine the Hudson River on a map, discuss all the commercial vessels that use the River to transport materials, then complete a...
Curated OER
Burger King Investigation
Young scholars study data on the nutritional value of Burger King meals in order to discover its nutritional value and also to compare the meals, using mathematical computation, to the recommended daily diet. In this data handling...
Curated OER
Asthma Survey
Learners collect survey data on the prevalence of asthma in a community. They summarize and display the survey data in ways that show meaning.
Curated OER
What is the Best Chip?
Scholars collect data about chips. They pick their favorite type of chip from a given variety such as potato chips, tortilla, or banana chips. Then they write on an index card their favorite chip and why it's their favorite. They also...
Curated OER
Mean, Median, and Mode
Fourth graders compare two sets of data by using a double bar graph. For this data analysis lesson, 4th graders study a double bar graph and complete questions based upon the data. Students construct a table to show the data from the...
EngageNY
Conditional Relative Frequencies and Association
It is all relative, or is it all conditional? Using an exploration method, the class determines whether there is an association between gender and superpower wish through the use of calculating conditional relative frequencies. The last...
Virginia Department of Education
Exponential Modeling
Investigate exponential growth and decay. A set of six activities has pupils collecting and researching data in a variety of situations involving exponential relationships. They model these situations with exponential functions and solve...
Curated OER
Light Travel Times
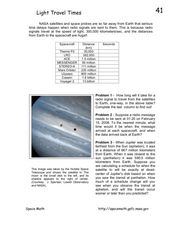
In this travel time of light worksheet, students read about the NASA satellites and space probes that transmit radio signals at the speed of light across huge distances. Students solve 3 problems about data transmission from space to...
Virginia Department of Education
Growing Patterns and Sequences
Learners explore, discover, compare, and contrast arithmetic and geometric sequences in this collaborative, hands-on activity. They build and analyze growing patterns to distinguish which kind of sequence is represented by a set of data...
Illustrative Mathematics
How Many Buttons?
Bring the class into the probability by having everyone count buttons on their shirts. Organize the data into the chart provided and chose different possibilities such as "female with one button" or "all students with more than four...
Curated OER
Conductivity - Pass the Buoy and Pepper, Please
Buoys around our coastlines are equipped with sensory devices which monitor temperature, salinity, and water pressure. Emerging earth scientists examine some of this data and relate salinity to the electrical conductivity of the surface...
Florida Department of Health
Safe and Happy: Safety for All at School and Online Unit
Bystander or upstander and advocate? Three lessons have high schoolers investigating data about bullying and school safety. Participants then learn how to take a stand against bullying and use what they have learned to create a PSA to...
Federal Reserve Bank
What Do Financial Market Indicators Tell Us?
Explain the four categories of financial indicators (commodity prices, stock indexes, interest rates, and yield spreads), and help your class members understand how changes in this data can affect decisions regarding consumer spending,...
Math Drills
Valentine's Day Ordering and Comparing (B)
Discover this Valentine's Day-themed instructional activity where young mathematicians answer word problems using data tables.
Curated OER
Counting Coins
Second graders identify a quarter, dime, penny, nickel, and dime. They match the coin with it's monetary value, collect data on excel spreadsheet, and create a graph in Excel. Students participate in group activities.
Curated OER
The Number of Neutrons
Although the focus of this learning exercise is the neutron, you cannot talke about them without also dealing with protons and electrons! Chemistry kids fill in a table of 14 elements, identifying the mass, atomic number, isotopic...
Illustrative Mathematics
Function Rules
Function machines are a great way to introduce the topic of functions to your class. Here, you will explore the input and output to functions both using numerical and non-numerical data. Learners are encouraged to play with different...
Illustrative Mathematics
Chocolate Bar Sales
In this real-world example, algebra learners start to get a sense of how to represent the relationship between two variables in different ways. They start by looking at a partial table of values that define a linear relationship. They...
Mathed Up!
Frequency Polygons
Frequency polygons are a different way to represent frequencies over intervals. Pupils take frequencies for intervals of data from a frequency table and plot them as a frequency polygon. Budding mathematicians find information about the...
Illustrative Mathematics
Invertible or Not?
Two for one—create an invertible and non-invertible function from the same data. The task presents a function table with missing outputs for the class to use to create two functions. One of the functions should have an inverse while the...
Kenan Fellows
Using Water Chemistry as an Indicator of Stream Health
Will this water source support life? Small groups test the chemistry of the water drawn from two different sources. They then compare the collected data to acceptable levels to draw conclusions about the health of the source. The...
Curated OER
Worksheet 3.1 Functions
Middle and high schoolers complete and solve 12 various types of problems. First, they express the output as a function of the input in each table. Then, pupils evaluate for the given variable when the value is as stated. In addition,...
Math Drills
Valentine's Day Ordering and Comparing (E)
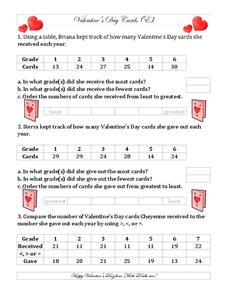
Love is in the air, and in a math table! Young learners chart the number of cards from each grade from least to greatest in three Valentine's Day word problems.
Other popular searches
- Data Tables
- Data Displays
- Displaying Data
- Create Data Table
- Data Table and Graph
- Creating Data Tables
- Science Data Tables
- Creating a Data Table
- Making Data Tables
- Organizing Data in Tables
- Solar System Data Table
- Data Tables and Graphing


