Curated OER
Read a Pictograph
In this data display worksheet, students solve 4 problems in which data on a tally chart and pictograph are analyzed. Students use this information to solve the problems.
Curated OER
Make Line Graphs
In this graphing worksheet, 5th graders use 2 line graphs to answer 4 word questions. They use data from two charts to make a single and a double line graph.
Curated OER
Function Tables
Students identify function using tables of data. For this algebra lesson, students create a tale of point and plot on a coordinate plane. They analyze the graph as being a function or not.
Curated OER
Frequency Tables and Histograms
In this graph worksheet, 5th graders study the data presented on a bar graph. Students then respond to 4 short answer questions using the information that has been provided.
Virginia Department of Education
Quadratic Curve of Best Fit
Class members create a table of the number of chords that can be drawn given the number of points on a circle. Pupils analyze the data created, find a function to fit to it, and use the function to make further predictions.
American Statistical Association
A Sweet Task
Candy is always an effective motivator! A fun math activity uses M&M's and Skittles to explore two-way frequency tables and conditional probability. The candy can serve a dual purpose as manipulatives and experimental data.
Statistics Education Web
I Always Feel Like Somebody's Watching Me
Future statisticians and potential psychics first conduct an experiment to collect data on whether a person can tell if someone is staring at them. Statistical methods, such as hypothesis testing, chi-square tests, binomial tests, and...
Kenan Fellows
Man vs. Beast: Approximating Derivatives using Human and Animal Movement
What does dropping a ball look like as a graph? An engaging activity asks learners to record a video of dropping a ball and uploading the video to software for analysis. They compare the position of the ball to time and calculate the...
NOAA
Tracking a Drifter
Be shore to use this drifter resource. The third installment of a five-part series has learners using the NOAA's Adopt-a-Drifter website to track to movement of a drifter (buoy) in the ocean. Graphing the collected data on a map allows...
Museum of Tolerance
Where Do Our Families Come From?
After a grand conversation about immigration to the United States, scholars interview a family member to learn about their journey to America. They then take their new-found knowledge and apply their findings to tracking their family...
Virginia Department of Education
Greenhouse Gas Modeling Activity
Why are greenhouse gases called greenhouse gases? Young Earth scientists learn about greenhouse gases though experimentation in the second installment of a 3-part series. They use lamps to model radiant energy as well...
NASA
Connecting Models and Critical Questions
Scholars use data to analyze and determine which sets of information need to be counted. They create a model to explain differences among chemical elements using graphs to prove concept mastery.
Curated OER
Displacement vs. Distance Worksheet
Displacement is a foundational concept for physics pupils. If they are having trouble discerning it from distance, this activity can help clear things up. The first page is essentially a piece of graph paper. It has a compass rose and a...
Curated OER
Graphing Sea Ice Extent in the Arctic and Antarctic
Students graph sea ice data and predict long term trends in the data. In this climate change activity, students use sea ice data from the Arctic and Antarctic to construct line graphs. They use their graphs to predict the effects of...
Curated OER
Graphing Favorite Fruit
Third graders take poll and sort data, enter the data to create a spreadsheet and create bar and pie graphs.
Curated OER
Dog Days or Dog Years?
In need of some algebraic fun with real world implications?Learners use ordered pairs, a table of values and a scatter plot to evaluate the validity of several real world data sets. The class focuses on dog ages in human...
Curated OER
Comparing Linear and Exponential Data
Students graph linear and exponential equations. In this algebra lesson, students differentiate between linear and exponential equations. They relate it to the real world.
Curated OER
Linear Patterns in Data
Eighth graders extend their learning of graphing linear equations and are introduced to connecting patterns in tables and graphs to represent algebraic representations. They then determine patterns and extrapolate information from these...
Curated OER
Interpreting Oceans of Data
Sixth graders analyze the data from a scientific experiment. In this statistics lesson, 6th graders answer questions about some data to show their understanding of the data. They apply the result to future decisions when using data.
Curated OER
Using Radiosonde Data From a Weather Balloon Launch
Student use radiosonde data from a weather balloon launch to distinguish the characteristics of the lower atmosphere. They learn the layers of the atmosphere. They graph real atmospheric data.
Curated OER
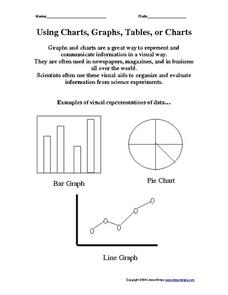
Using Charts, Graphs, Tables, or Charts
In this charts, graphs and tables activity, students view 3 different types of visual representations of data, make a list of 20 items and decide how the items can best be put together in groups to make a graph, chart or table. Students...
Curated OER
Angles and Arcs
In this angles and arcs worksheet, 10th graders solve 18 various types of problems related to determine various angles and arcs of a circle. First, they find the measure of each angle and arc of the first circle shown. Then, students...
Curated OER
Proportionality in Tables, Graphs, and Equations
Learners create different methods to analyze their data. In this algebra lesson, students differentiate between proportion and non-proportional graph. They use the TI-Navigator to create the graphs and move them around to make their...
Curated OER
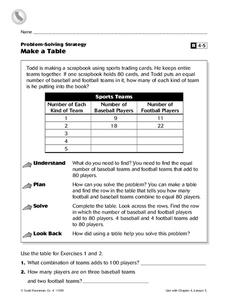
Make a Table
In this charting worksheet, 4th graders complete a table. Using the information provided, students fill in the missing data and complete 2 short answer questions.
Other popular searches
- Data Tables and Graphing
- Graphs and Data Tables
- Create Data Tables From Graphs
- Data Displays and Graphs
- Data Reading Graph Table


