EngageNY
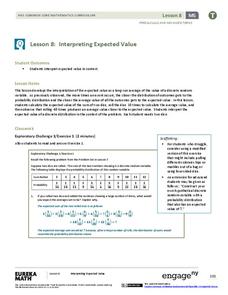
Interpreting Expected Value
Investigate expected value as a long-run average. The eighth installment of a 21-part module has scholars rolling pairs of dice to determine the average sum. They find aggregate data by working in groups and interpret expected value as...
Curated OER
The Golden Students
Scholars view the video, "Donald Duck in Mathmagic Land," and discuss examples in nature which have proportions of the golden ratio. They measure and record different body lengths from a worksheet and convert the ratios to equivalent...
Curated OER
Matrix Analysis of Networks
Explore the connection between a finite graph, a directed graph, and a matrix. Graph lines and identify the relationship of matrices in real-world scenarios. Then use this information to work with a partner to plan and design a town...
EngageNY
Interpreting the Graph of a Function
Groups sort through NASA data provided in a graphic to create a graph using uniform units and intervals. Individuals then make connections to the increasing, decreasing, and constant intervals of the graph and relate these connections...
Towson University
It's a Gassy World!
How much does your class know about the relationship between climate change and carbon dioxide? Science scholars explore the nature of greenhouse gases and rising ocean temperature through demonstrations, research, and experiments. The...
Wisconsin Online Resource Center
Oversized Inch
Each member of the class creates their own paper ruler. Using their ruler, kids walk around the room measuring the objects you've specified. Discuss how items should be measured to the 16th of an inch, the smallest unit on their ruler....
Nuffield Foundation
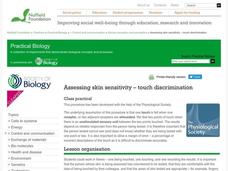
Assessing Skin Sensitivity—Touch Discrimination
How do we distinguish between the number of things touching our skin? Scholars explore an interesting lesson through an experiment. They learn that there must be an unstimulated sensory unit between two touches to distinguish them. They...
Curated OER
Inquiry Unit: Modeling Maximums and Minimums
Young mathematicians explore the maximun area for patio with the added complexity of finding the mimimum cost for construction. First, they maximize the area of a yard given a limited amount of fence and plot width v. area on a scatter...
American Statistical Association
Spinners at the School Carnival (Equal Sections)
Spin to win a toy car. A fun activity has pupils use a spinner in which three of the equal sections represent winning a toy car, and the fourth section represents no car. They record the number of wins after certain numbers of spins,...
Kenan Fellows
Using Water Chemistry as an Indicator of Stream Health
Will this water source support life? Small groups test the chemistry of the water drawn from two different sources. They then compare the collected data to acceptable levels to draw conclusions about the health of the source. The...
EngageNY
Events and Venn Diagrams
Time for statistics and learning to overlap! Learners examine Venn Diagrams as a means to organize data. They then use the diagrams to calculate simple and compound probabilities.
Curated OER
Which Fish Where?
Here is a lesson outline that prompts elementary learners to graph and analyze data regarding fish caught along the Hudson River. They will review vocabulary and complete 2 worksheets which can be accessed by clicking on the provided links.
Curated OER
The Race of Baseball All-Stars
Collect and analyze data. Pupils graph their data and model with it to solve real life problems. They use logic and deductive reasoning to draw conclusions.
Curated OER
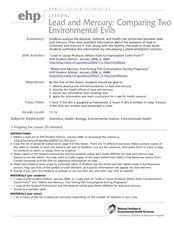
Lead and Mercury: Comparing Two Environmental Evils
High schoolers in chemistry or health courses look at the material safety data sheet (MSDS) and periodic table of elements to gather information about mercury and lead, two toxic materials that have been found in food products. They read...
Curated OER
Finding Equations
Students make equations from everyday data. They create a graph from the equations. Students predict and analyze the results. Students complete the second scenario on their own and turn in their handout.
Curated OER
Facts on Fish Species
Here is a brief outline of facts on various Chesapeake Bay fish species. Use it as an example of what kind of information you want your life science learners to collect when you assign them a specific species to research. Another way to...
Curated OER
Latitude
Young scholars examine the theory of finding latitude and discuss the uses of an astrolabe, cross-staff and octant. They determine an Astronomical Table for their classroom.
Curated OER
How Do You Read Stock Quotes Online ?
Students explore how to get and interpret stock price data online. They also describe certain aspects of various corporations and know the meanings of important terms involving the stock market.
Curated OER
Experiment to Mimic the Digestive System
Biology lab technicians take a cheese sandwich apart as a demonstration of digestion. They record appearance and mass both before and after the process, which mimics chewing, acid action, and churning. Learners write their own lab...
Curated OER
Sweethearts and Data Analysis
Learners explore the concept collecting and representing data. In this collecting and representing data lesson, students record the different colors of sweetheart candies in their sweethearts box. Learners create a table of the data and...
Curated OER
National Marine Sanctuaries Fish
Information is provided on Gray's Reef, Florida Keys, and Flower Garden Banks marine sanctuaries. Young marine biologists then visit the FishBase and REEF databases to collect fish species information for each location. They then...
Curated OER
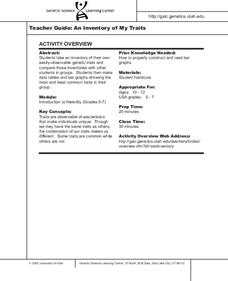
An Inventory of My Traits
Students take an inventory of their own easily-observable genetic traits and
compare those inventories with other students in groups. They then make
data tables and bar graphs showing the most and least common traits in their group.
Curated OER
Conducting a Scientific Investigation
Students investigate a possible health problem in the local school district through inquiry into attendance records, activities, maps, graphs, and data tables. The simulation continues as solutions for the problem are sought.
Curated OER
Testing the Waters
Eleventh graders examine a local body of water. In this science lesson, 11th graders collect water samples to test. Students analyze the data and make conclusions. Students create tables and graphs of the data.
Other popular searches
- Creating Data Tables
- Science Data Tables
- Making Data Tables
- Organizing Data in Tables
- Data Tables and Graphing
- Graphs and Data Tables
- Data Tables and Charts
- Create Data Tables From Graphs
- Data Tables Lesson Plans
- Data Tables Surveys
- Pocket Data Tables
- Using Data Displays


