Songs for Teaching
Songs for Teaching: Scientific Method Blues
This lesson introduces the scientific method to your students through song. Students will learn the steps of the scientific method through this great song written by Kathleen Carroll. Click on the link and play it for your whole class.
Science Education Resource Center at Carleton College
Serc: Investigating the Magnetic Force Field: Calculating Magnetic Pull
In this classroom activity, the students will investigate the magnetic pull of a bar magnet at varying distances with the use of paper clips. Students will hypothesize, conduct the experiment, collect the data, and draw conclusions that...
Scholastic
Scholastic: Dirtmeister's Science Lab: Let the Sun Shine In
Students graph data reflecting time of day and length of shadow, and then draw conclusions about Earth's seasons and position in relation to the Sun.
TeachEngineering
Teach Engineering: Wild Wind
Students will learn the difference between global, prevailing and local winds. In this activity, students will make a wind vane out of paper, a straw and a soda bottle and use it to measure wind direction over time. Finally, they will...
Other
The Habitable Planet Simulation
This activity is designed to accompany an interactive on the Annenberg Learner website. Students investigate the changes that take place in an ecosystem when they alter the organisms in a food web. As they work with the simulation, they...
Other
Honolulu Community College: Galileo's Kinematics
In this experiment you will attempt to reproduce Galileo's results using the inclined plane. You will test three hypotheses relating to motion on an incline. You will learn to draw a "best fit" or regression line of experimental data....
Louisiana Department of Education
Louisiana Doe: Louisiana Believes: English Language Arts: Grade 6: If Stones Could Speak
Sixth graders will explore history and will learn that archaeologists, like detectives, work to piece together the past through investigation. Archaeological research provides us with stories of human history that help us understand the...
Illustrative Mathematics
Illustrative Mathematics: F Bf 1,000 Is Half of 2,000
This task is about an online mathematics organization that is trying, over a four-year period, to generate 2,000 math problems that cover all grades. This real-life modeling task could serve as a summative exercise that draws on many...
Texas Instruments
Texas Instruments: Is There a Limit?
In this activity, students examine data about bacteria and their growth. They produce a scatter plot, a best-fit model, and draw conclusions based on the data and graph.
Science Education Resource Center at Carleton College
Serc: How Wind Affects Various Objects
For this activity, young scholars experiment with various objects in a wind tunnel. Together, they record predictions and data in a class data table. Students will then use the information gained in the experiment to draw conclusions...
PBS
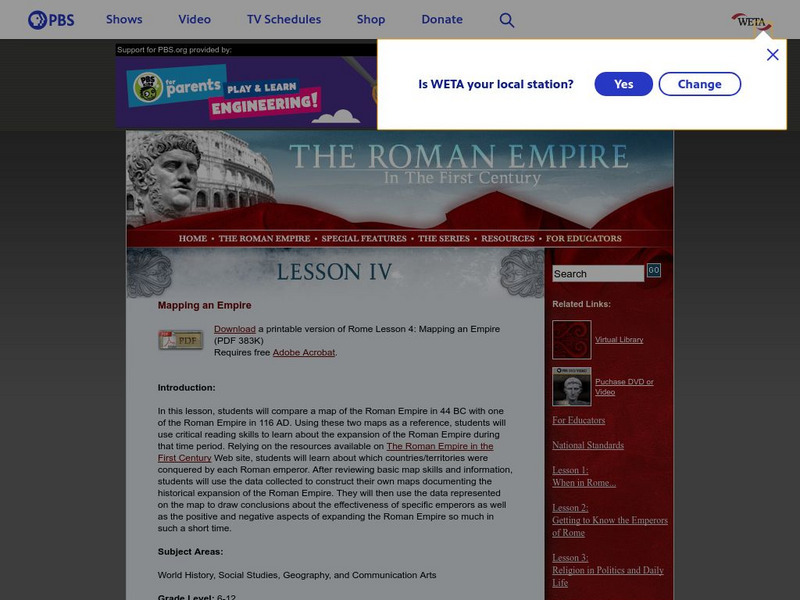
Pbs: The Roman Empire of the 1st Century: Mapping an Empire
In this instructional activity, students will compare a map of the Roman Empire in 44 BC with one of the Roman Empire in 116 AD. Using these two maps as a reference, students will use critical reading skills to learn about the expansion...
TeachEngineering
Teach Engineering: A Closer Look at Oil and Energy Consumption
Students analyze international oil consumption and production data. They make several graphs to organize the data and draw conclusions about the overall use of oil in the world.
Texas Instruments
Texas Instruments: Variety Is the Spice of Life
In this activity, students will collect data on all members of the class. They will make a graph of the data collected, interpret variations, and then draw conclusions.
Science Education Resource Center at Carleton College
Serc: Investigating Factors Influencing Rates of Chemical Reactions
This lab investigates the factors that influence rates of reactions. Learners will develop a hypothesis, test the hypothesis, collect data, then draw a conclusion based on the data.
Science Education Resource Center at Carleton College
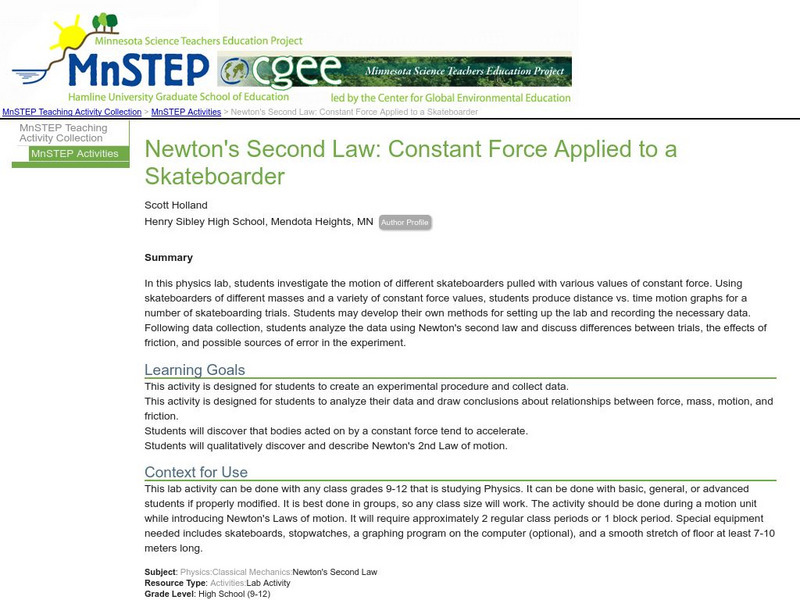
Serc: Newton's Second Law: Constant Force Applied to a Skateboarder
In this lab activity, students will become familiar with Newton's 2nd Law of Motion. By investigating the motion of different skateboarders pulled with a variety of constant force values, they will discover that bodies acted on by a...
Cynthia J. O'Hora
Mrs. O's House: Develop a Bird Feeder Watch List
Students will develop a list of local birds they might see at their home bird feeder. Once the list is compiled, observations of the birds will occur. Students will draw conclusions based on the data collected and report it to the class.
Science Education Resource Center at Carleton College
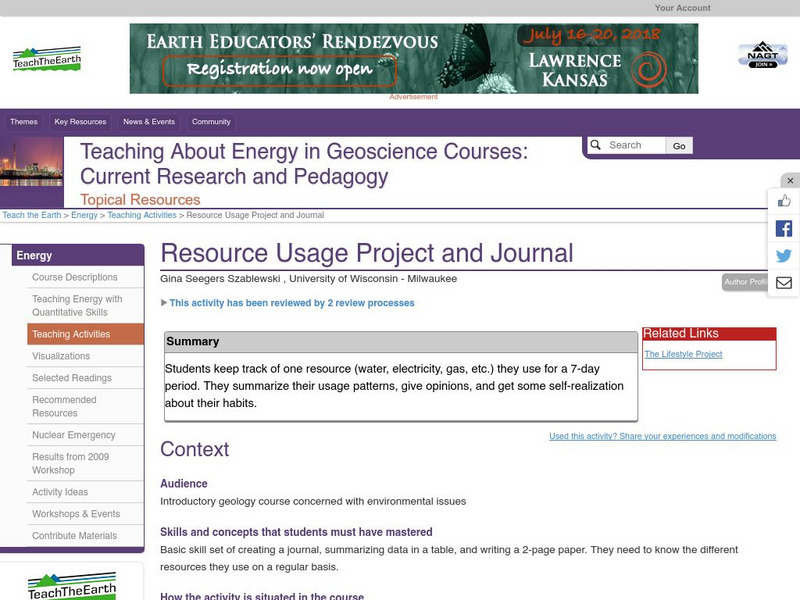
Serc: Resource Usage Project and Journal
Students pick a resource and track their use of it over the course of one week. Students record their data in a spreadsheet, write a summary of it, and draw conclusions from their usage patterns. A detailed student handout is provided.
Khan Academy
Khan Academy: Valid Claims
Practice figuring out whether we took a random sample and whether we're able to draw valid conclusions from our data. Students receive immediate feedback and have the opportunity to try questions repeatedly, watch a video or receive hints.
Shodor Education Foundation
Shodor Interactivate: Advanced Fire
Run a simulation of how a fire spreads through a stand of trees, learning about probability and chaos. Track the results of multiple burns and use the data to draw conclusions.
Other
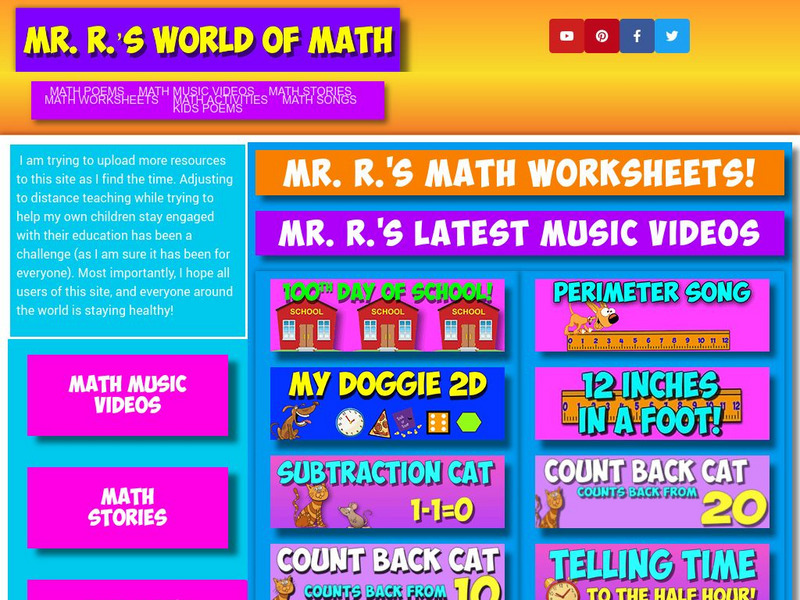
Welcome to mr.r's World of Math!!!
At this site, math word problems are presented in an exciting and creative format. Students attempt to find solutions to hilarious situations using their mathematical skills. To do this they must solve various math problems in a certain...
Physics World
Physics World: Contextual Physics in Ocean Park
After downloading the "Motion Video Analysis" software, users can collect data about moving object's position from digital movie clips. This collection of data will allow them to plot motion graphs and draw conclusions about physics in...
Michigan State University
Michigan State University: Lets Net: Heart Rate
In this experiment, students will compare heart-rates of classmates and family member to draw conclusions about their data. Students can collect data and collaborate with others on the Internet to broaden their sample size. Lesson...


