Curated OER
South Asian Architecture
Seventh graders review and discuss architecture from South Asia. They then study images of various buildings from North Africa/Southwest Asia, and make comparisons
Curated OER
An Acquaintance with Darkness, a Civil War
Eighth graders explore the Civil War, and people and events surrounding the assassination of Abraham Lincoln and his funeral procession.
Curated OER
The Silk Road, An Ancient Internet
Pupils examine how goods and ideas moved along an ancient trade route between China and Europe. They make charts of items, ideas, etc. that were transported along the Silk Route.
Curated OER
American Journeys: Right Place, Right Time
Sixth graders measure distances on a map using string and a ruler. They complete mathematical word problems about measurement.
Curated OER
School Yard Waste
Fourth graders examine the types of garbage that they collect on the playground. They collect the information in a spreadsheet and create a graph that displays the number of types of trash found. They design and monitor a playground...
Curated OER
Sweet Data
Young scholars input data about the colors of their serving of M&M candies onto a spreadsheet. They create charts and graphs based on this information.
Curated OER
Classroom demographics
Students use strategies to read and comprehend words and material. The use of technology is the backbone of this lesson and is essential for implementation.
Curated OER
Classic Columns
Sixth graders present a PowerPoint presentation on Greek columns. They realize that Greek culture is centered around religion. Students create a model of one of the columns. Also they find examples of Greek architecture in major Greek...
Curated OER
The Hot Dog Stand - An Annual Report
Students run a computer simulation and collect data as they work and use the data to create an annual report for their business. It is desirable for students to do this project individually, but it could be done as a class using a large...
Curated OER
Science: How to Identify Insects
First graders discover how to distinguish spiders from insects by understanding the characteristics of each. They sort online picture pages into the two groups and examine the insects for common attributes. Students complete a worksheet...
Curated OER
Organizing the Elements
Ninth graders examine the periodic table and discover why the elements in the table are organized the way they are through research. Students infer information about the elements and the relationships among them that leads to their...
Curated OER
The Wetlands
Complete a comparison of the wetlands found in New York and Louisiana. Using various research methods, gather data on the wetlands found in New York and Louisiana, the animals, conditions, etc. Data is used to create a brief report on...
Curated OER
Data With Candy
Students, while utilizing the classroom and the computer lab with a bag of colored candy, gather and interpret data, calculate averages and draw conclusions and draw a bar graph. They estimate how many candies are in the bag, what...
Curated OER
Create a Holiday
Students create their own holidays, describing them in booklet form. They develop the holiday's name, symbol, colors, food, and historical significance.
Curated OER
Fraction Spelling
An interesting take on spelling practice is included here! Emerging spellers take their weekly spelling list and create a three-column chart. In the first column, they write the word itself. In the second column, they write how many...
Curated OER
Exponential Models
Students fit a continuous change exponential model to U.S. population data and use the model to predict future population.
Curated OER
Visit To the Farm
Students research farm animals and write a story based on the research.
Curated OER
What is A Stock Screener?
Students choose stocks from thousands of companies by using a tool called a stock screener to select stocks that fit their investing criteria, such as price-to-earnings ratio, earnings growth, and the past year performance.
Curated OER
Where is Everybody?
Learners collect data from different grade levels at their school and develop thematic maps which show population density, and determine how this might affect the school and themselves in the future.
Curated OER
Chart Making for Navigators
Students discuss the importance and function of nautical maps for sailors. They, in groups, take soundings of a simulated bay in a shoebox and develop a nautical chart that enable them to navigate the shoebox safely.
Curated OER
Charting Neptune's Realm: Profiles
Students identify and describe the importance of nautical profiles in early navigation. They draw a profile of a street or mall and explore the effectiveness of different types of directions.
Curated OER
GENERATE YOUR OWN HYDROPOWER
Students build a water wheel, a simple galvanometer, and a simple hydropower generator, plus detect the electricity generated.
Curated OER
I'm All Mixed Up
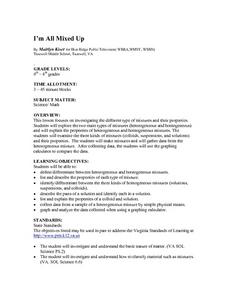
Middle school scientists compare and contrast heterogeneous and homogeneous mixtures. They differentiate solutions, colloids, and suspensions by examining samples of each. Note that the bulk of the lesson plan directs you how to...
Curated OER
Color Theory & Using Layers
Students investigate the color wheel theory and incorporate it into simple sketches on their handheld. The importance of the use of layering and the difference between primary, secondary, and tertiary colors is presented in this lesson.
Other popular searches
- Databases. Search Engines
- Access Databases
- Microsoft Access Databases
- Creating Databases
- Using Databases
- Creating Access Databases
- Library Databases
- Searching Databases
- Election and Databases
- Learning About Databases
- Databases Lesson
- Appleworks Databases


