Yummy Math
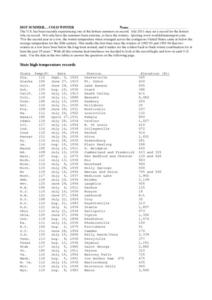
Hot Summer. . . Cold Winter
A table of each state's record temperature reports data that middle schoolers can place on a number line for analysis. A written explanation of how to use this tool and the concept of absolute value are also included. Nine questions are...
Mathematics Assessment Project
Middle School Mathematics Test 2
A 13-page test with two 40-minute sections covers multiple years of math content. It incorporates applied problems and mathematical analysis.
CK-12 Foundation
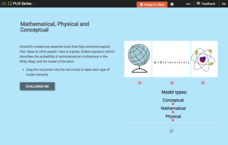
Modeling: Mathematical, Physical and Conceptual
Scientific models help explain ideas and concepts to non-experts. The online activity covers conceptual, mathematical, and physical models. Through four multiple-choice questions and three discussion questions, scholars gain a deeper...
CK-12 Foundation
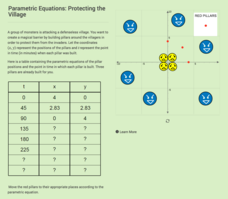
Parametric Equations: Protecting the Village
Determine the location of the pillars in time. Given a table of values for two parametric equations, pupils complete the table to determine the location and time it takes to build the pillars. Learners plot the points representing...
CCSS Math Activities
Out of the Swimming Pool
Out of the swimming pool and into the math classroom! Young mathematicians analyze two linear functions representing the number of liters of water in a pool as it drains over time. They must evaluate functions, interpret function...
Curated OER
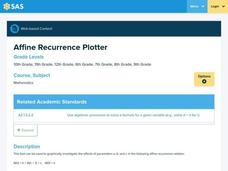
Affine Recurrence Plotter
Learners use the on-line affine recurrence plotter to graph equations. They work on-line to create graphs of trout in a trout pond and savings account balances when interest is compounded over time. Links to the four one-day lessons are...
Math Worksheets Land
Partitioning Circles and Rectangles- Independent Practice
Start simple by using a shape-partitioning worksheet. Scholars begin by segmenting basic shapes in halves and quarters. On the second page, they move on to more complex shapes, such as a heart and a cross, also partitioning them in half...
West Contra Costa Unified School District
Solving Equations with Variables on Both Sides
So many different ways to solve equations, so little time! Scholars learn how to solve equations with variables on both sides by using several different methods. They apply bar models, decomposition, and traditional algebraic methods to...
CK-12 Foundation
Angles of Rotation in Standards Positions: Clock Angles
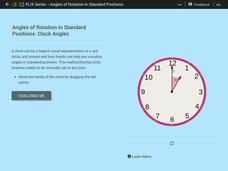
Use a clock face to develop angles representing standard position angles. The interactive allows pupils to create angles using the hands of a clock. Scholars discover that there is a difference in the angle formed using a clock face and...
CK-12 Foundation
Sample Spaces and Events: Triple Spin!
Scholars determine the number of possible outcomes when a spinner is spun three times. They start with the case of one spin and build up to the case of three spins.
CK-12 Foundation
Single Variable Expressions: Neighborhood Block
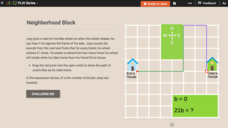
The number of bicycle wheel turns is as good as any way to describe the distance from school to home. An interactive lets young mathematicians determine the number of city blocks a person bicycles. They use this information along with an...
CK-12 Foundation
Data Summary and Presentation: Chart for Grouping Data
Get social! Create a display of social media use for a class. Pupils use provided information about the time spent on social media to construct a histogram. Using the histogram, learners interpret the data to answer questions.
CK-12 Foundation
Displaying Univariate Data: Ordering Leaves
Leaf a little time to organize data. Given data displayed in a stem-and-leaf plot, learners organize the data in a list. Pupils use the data to determine the mode, median, and range of the data set. They determine the benefits of using a...
CK-12 Foundation
Understand and Create Histograms: Car Sales
Create a history of car sales. Pupils create a histogram/bar graph to show the number of car sales made during the week. Using the data display, learners calculate numerical summaries of the data and find the percent of cars sold during...
CK-12 Foundation
Broken-Line Graphs: Heating Curve of Water
Examine the unique graphs coined broken-line graphs. Using the phase change of water for data, learners answer questions related to the temperature and energy at different times in the cycle of the phase change. Questions focus on the...
CK-12 Foundation
Two-Sided Stem-and-Lead Plots: Gamers
Which gender spends more time playing video games? Your classes use provided data to answer this question. They first build a two-sided stem-and-leaf plot and then use the display to look for patterns. Guiding questions help them...
Coloring Squared
Thanksgiving Turkey—Holiday Subtraction
It's time to practice 2-digit subtraction up to 20 the fun way. Learners solve a grid full of subtraction problems and then color each square the appropriate color according to the key. The final picture: a turkey!
CK-12 Foundation
Inverse Functions: Definition of Inverse Functions
Is the inverse of a function also a function? Pupils manipulate the graph of a function to view its inverse to answer this question. Using a horizontal and vertical line, class members determine whether the initial function is...
Curated OER
Time and Again
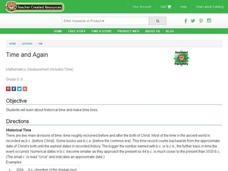
Students examine historical time and make time lines. They study the two main divisions of time; the time before and after the birth of Christ. They also note that time lines are a way of illustrating the length of historical time.
Curated OER
Using Time Conversion Charts
In this time conversion activity, 8th graders solve 8 different problems that include using various types of time conversion charts for each situation. They determine when the data was taken and the age of the data using the listed...
Curated OER
Math Lesson 30
In these math lessons worksheets, 4th graders practice their multiplication, addition, and subtraction skills by completing the 20 pages of equations and word problems.
Curated OER
Grade Five Math Test B
In this grade 5 math test worksheet, 5th graders complete a 30 question multiple choice quiz covering a variety of grade 5 concepts.
Soft Schools
Long Division Worksheets
They say practice makes perfect. If that's the case then these worksheets will have young mathematicians perfectly solving long division problems in no time.
Curated OER
Time Booster (pg.3)
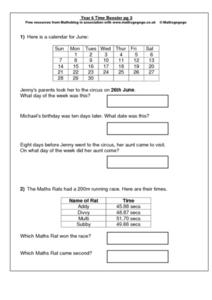
In this calendar and times worksheet, students look at a calendar for the month of June in order to answer 3 short answer questions. Students look over a Math Rats running race chart with times on it in order to answer 2 short answer...


