Khan Academy
Khan Academy: Dependent and Independent Variables
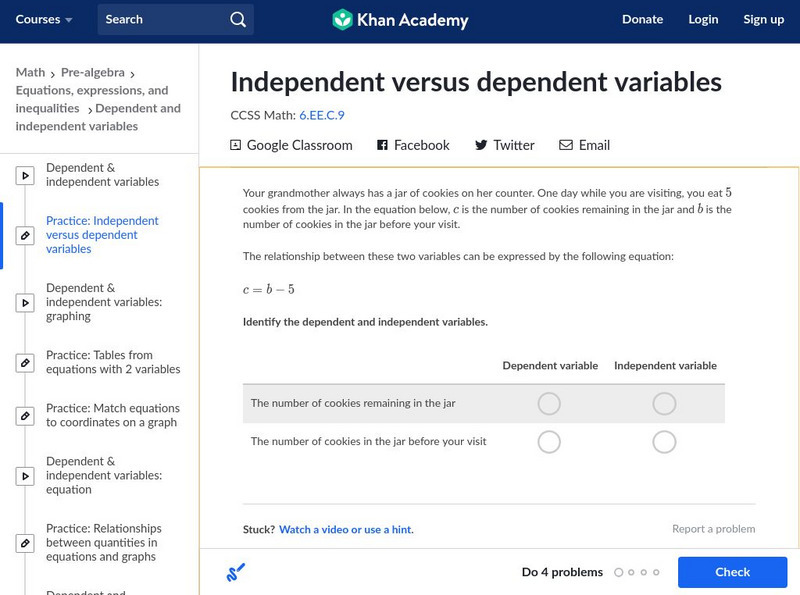
In this exercise, students practice identifying dependent and independent variables. Students receive immediate feedback and have the opportunity to get hints and try questions repeatedly.
Khan Academy
Khan Academy: Identify Dependent & Independent Variables
Practice figuring out if a variable is dependent or independent. Students receive immediate feedback and have the opportunity to try questions repeatedly, watch a video or receive hints.
PBS
Pbs: Valentine Cards: Exploring Relationships Between Variables
Determine how many valentines will be exchanged depending on the number of students in each class. This interactive exercise focuses on examining data to find a pattern and extending the pattern until a rule can be realized, taking math...
Texas Education Agency
Texas Gateway: Experimental Design
Given investigation scenarios and lab procedures, students will identify independent variables, dependent variables, constants, and control groups.
Sophia Learning
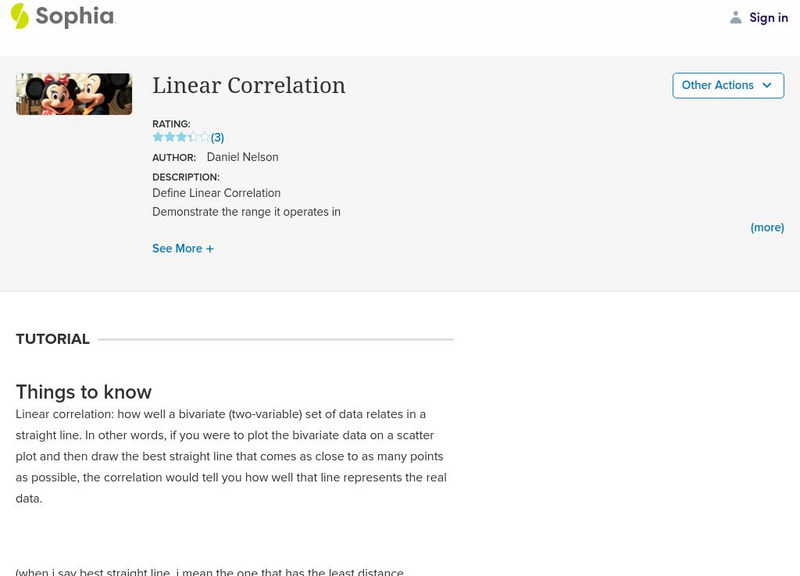
Sophia: Linear Correlation Tutorial
Use examples to determine and explain the linear correlation of independent and dependent variables.
Vassar College
Vassar College: Multiple Regression
This is an interactive site allowing the student to input data (one dependent and three independent variables) and then letting the computer calculate the regression between these multiple forces.
US Department of Education
National Center for Education Statistics: Create a Graph Tutorial
This tutorial walks students through how to create different types of graphs using the Create a Graph tool available on the website. Covers bar graphs, line graphs, pie charts, area graphs, scatter plots, and dependent and independent...
TeachEngineering
Teach Engineering: Cars: Engineering for Efficiency
Students learn how the aerodynamics and rolling resistance of a car affect its energy efficiency through designing and constructing model cars out of simple materials. As the little cars are raced down a tilted track (powered by gravity)...
Vision Learning
Visionlearning: Research Methods: Experimentation in Scientific Research
An explanation of scientific research using variables and controls.
ClassFlow
Class Flow: Functions and Their Graphs
[Free Registration/Login Required] Functions can be specified in a number of ways. Students concentrate on functions given by equations involving independent and dependent variables and begin to recognize the different forms to find the...
CK-12 Foundation
Ck 12: Biology: Science Experiments
[Free Registration/Login may be required to access all resource tools.] Covers the scientific experimental design.
Other
Stat Soft: Getting Started With Statistics Concepts
Definitions of the basic concepts in statistics. Great for review and discussion or for introduction into topics.
Shodor Education Foundation
Shodor Interactivate: Multiple Linear Regression
Students compare multiple independent variables as predictors of one dependent variable. Students explore correlation and lines of best-fit.
Texas Instruments
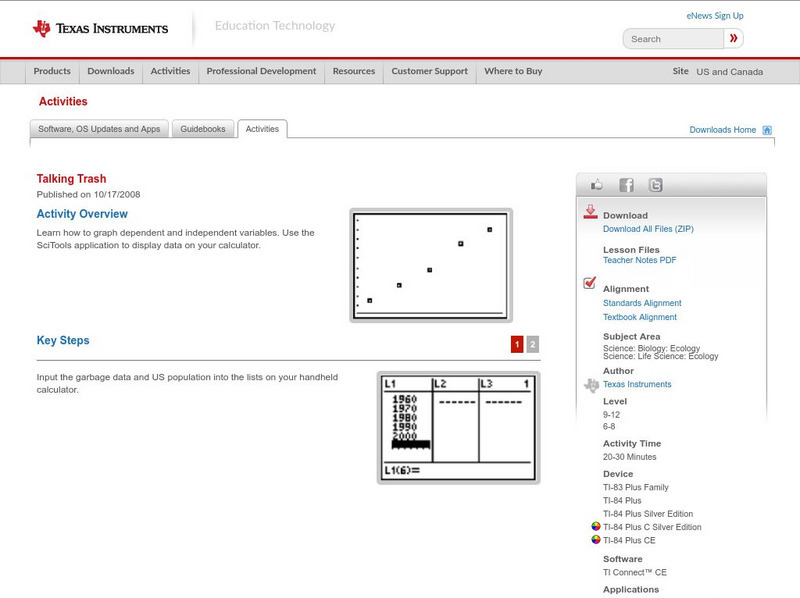
Texas Instruments: Talking Trash
Learn how to graph dependent and independent variables. Use the SciTools application to display data on your calculator.
TeachEngineering
Teach Engineering: Mint Mobiles
Students design, build and test model race cars made from simple materials (lifesaver-shaped candies, plastic drinking straws, Popsicle sticks, index cards, tape) as a way to explore independent, dependent and control variables. They...
Math Medics
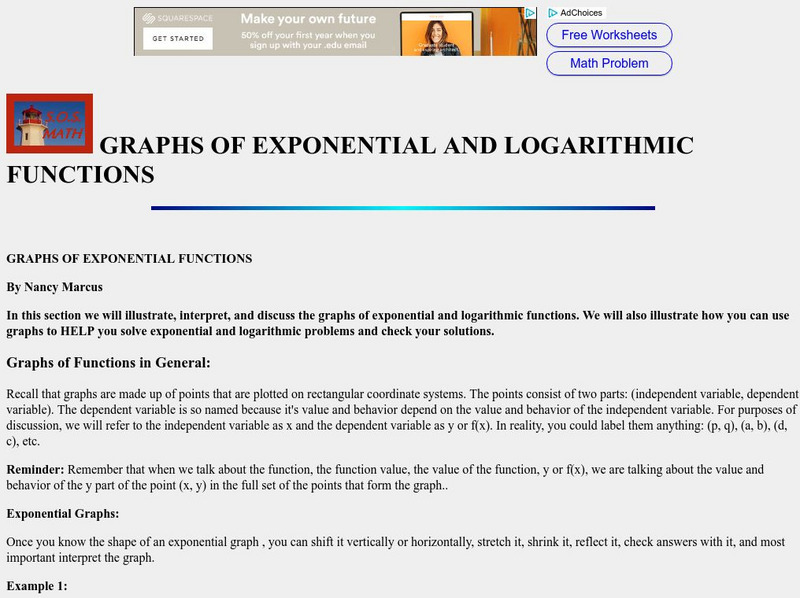
S.o.s. Math: Graphs of Exponential & Logarithmic Function
This lesson gives brief description of dependent and independent variables and how they relate to the exponential and logarithmic functions.
Texas A&M University
Wtamu Virtual Math Lab: Intermediate Algebra
This site is a tutorial for students in algebra 2 or for those who need a refresher. The site has explanations, definitions, examples, practice problems and practice tests are found covering topics such as linear equations, graphing,...
Georgia Department of Education
Ga Virtual Learning: Causation
In this comprehensive interactive tutorial you will learn about cause and effect in disease occurrence.
Science Education Resource Center at Carleton College
Serc: Investigating Motion: Calculating and Graphing Students Walking Speed
In this activity students will collect and analyze data of their walking speed. They will compare their speed to an outside speed walker. They will determine their speed every 20 meters up to 100 meters. They will complete five trials to...
Rice University
Hyper Stat Online Statistics Textbook: Trend Analysis
A series of pages that help us understand testing one or more components of a trend using specific comparisons, a set of coefficients, error analysis of variance and the probability value.
Concord Consortium
Seeing Math: Function Analyzer
The Function Analyzer allows learners to see the connections among three representations of a function: symbolic, area, and graphic. In addition, by allowing learners to change the value of four elements of a function - the coefficient...
Texas Instruments
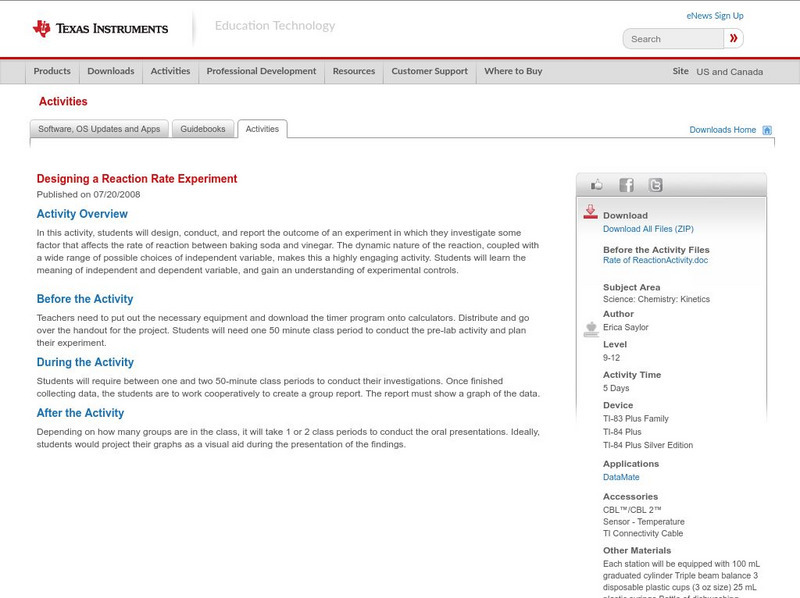
Texas Instruments: Designing a Reaction Rate Experiment
In this activity, students will design, conduct, and report the outcome of an experiment in which they investigate some factor that affects the rate of reaction between baking soda and vinegar. The dynamic nature of the reaction, coupled...
Khan Academy
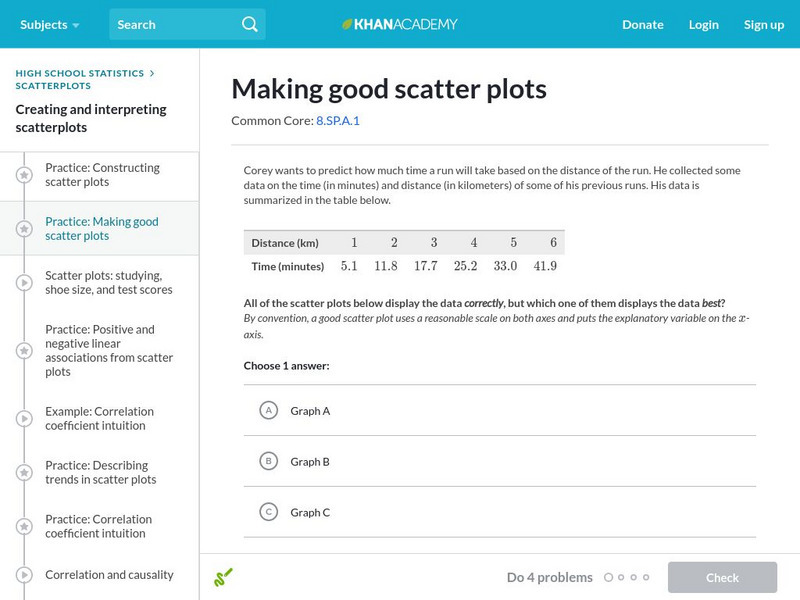
Khan Academy: Making Good Scatter Plots
A good scatter plot has the independent variable on the x-axis and the dependent variable on the y-axis. Also, the scale of both axes should be reasonable, making the data as easy to read as possible. In these practice problems, we...
Texas Instruments
Texas Instruments: Distance vs. Time to School
This is a linear activity where the teacher and/or students collect data about the distance they live from school and how long it takes to get to school. This is a modeling activity where time is the dependent variable.


