EngageNY
From Ratio Tables, Equations and Double Number Line Diagrams to Plots on the Coordinate Plane
Represent ratios using a variety of methods. Classmates combine the representations of ratios previously learned with the coordinate plane. Using ratio tables, equations, double number lines, and ordered pairs to represent...
EngageNY
Estimating Probability Distributions Empirically 1
What if you don't have theoretical probabilities with which to create probability distributions? The 11th installment of a 21-part module has scholars collecting data through a survey. The results of the survey provide empirical data to...
EngageNY
Negative Exponents and the Laws of Exponents
Apply the properties of exponents to expressions with negative exponents. The fifth lesson in the series explains the meaning of negative exponents through an exploration of the properties taught in the previous lessons of the...
EngageNY
Definition of Translation and Three Basic Properties
Uncover the properties of translations through this exploratory lesson. Learners apply vectors to describe and verify transformations in the second installment of a series of 18. It provides multiple opportunities to practice this...
Curated OER
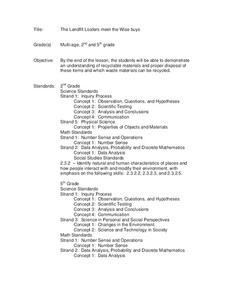
The Landfill Loafers Meet the Wise Buys
Students discover recyclable materials and the proper disposal of those items through Internet research. Working in groups of four, they search the Internet for uses of recyclable materials. After research is complete, they participate...
Curated OER
NUMB3RS - Season 2 - "Convergence" - Air Hockey
Learn how to use a matrix to organize data to solve a problem. This activity uses wins and losses to rank players for an air hockey tournament they wish to have. After practicing some basic matrix operations the class could do the...
Curated OER
Properties of Matrices
A TI-nspire lesson to find determinants of matrices using calculators. The class follows along in this step by step activity to explore operations on matrices. They will mostly be multiplying and at the end of the lesson they are guided...
Curated OER
Get the Picture!
Astronomers practice downloading data from a high-energy satellite and translate the data into colored or shaded pixels. As a hands-on activity, they use pennies to simulate high-energy satellite data and they convert their penny...
Teach Engineering
Discovering Phi: The Golden Ratio
Fe, phi, fo, fum. This activity leads pairs to find the ratio of consecutive terms of the Fibonacci sequence. The pairs find that the Fibonacci sequence can be found in many places. A discussion with the class shows that the ratios...
Curated OER
Graphs and Data
Students investigate poverty using graphs. In this algebra lesson, students collect data on the effects of poverty and use different rules to analyze the data. They graph and use the trapezoid rule to interpret the data.
Shodor Education Foundation
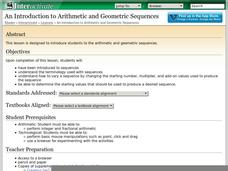
An Introduction to Arithmetic and Geometric Sequences
Help your class look for patterns as they create their own arithmetic and geometric sequences. Engage learners with an introductory discussion on sequences and use the applet to let them explore how sequences are formed. Teachers might...
Howard Hughes Medical Institute
Population Dynamics
Will human population growth always be exponential, or will we find a limiting factor we can't avoid? Young scientists learn about both exponential and logistic growth models in various animal populations. They use case studies to...
Curated OER
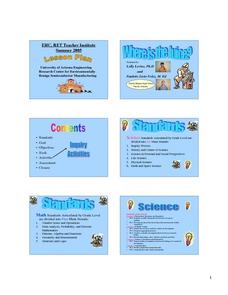
Where Is The Juice?
Students are introduced to the component's of Ohm's Law. In groups, they practice their problem solving skills by reviewing problems solved earlier. They participate in activities that help them gather information on the importance of...
Mathematics Vision Project
Module 4: Rational Functions
Time to study the most sensible function — rational functions! The seven-lesson unit develops the concept of a rational function through a connection to rational numbers and fractions. Scholars graph functions, solve equations, and...
Curated OER
Do You Feel Lucky?
Students explore probability by using games based on probable outcomes of events. They name all of the possible outcomes of an event and express the likelihood of such an event occurring.
Mathematics Vision Project
Module 2: Linear and Exponential Functions
Write, graph, and model all things linear and exponential. Building on the previous module in a nine-part Algebra I series, learners compare linear exponential modeling. They write equations, graph functions, and analyze key features.
Mathematics Assessment Project
Sampling and Estimating: Counting Trees
Your task today: count all the trees on a tree farm. To complete the assignment, learners first estimate the number of trees on a tree farm using random sampling. To improve their own response they then evaluate provided...
Mathematics Assessment Project
Representing Functions of Everyday Situations
Functions help make the world make more sense. Individuals model real-world situations with functions. They match a variety of contexts to different function types to finish a helpful resource.
Curated OER
DC Branch Current Analysis
Engage your class in physics with this series of questions. The first question is the most hands-on and asks learners to build their own circuit. The rest of the questions are related to current analysis. Class members solve 7 problems...
Curated OER
Fibonacci II
Study Fibonacci sequences and see a related set of numbers. Learn and review Lucas numbers and use of quadratic equations to find a general term of a sequence of numbers that is generated by a recurrence relation similar to Fibonacci's.
Curated OER
Repeating Decimal as Approximation
You are used to teaching repeating decimals with bar notation that keeps us from writing that number over and over again; now teach what the over and over again represents. This activity allows your mathematicians to explore the infinite...
Illustrative Mathematics
Seeing is Believing
How many visual models can be used to show multiplication? Three basic kinds of models can be used to represent and explain the equation 4 x (9 + 2). The commentary section provides description and graphics to explain the set...
Curated OER
Latitude
Your young geologists generate a graph given a table of values from the context of latitude and percent of the earth's surface north of that latitude. The questions in the activity then focus the learners to a deeper understanding of the...
Other popular searches
- Discrete Mathematics Graph
- Discrete Mathematics Grade 5
- History Discrete Mathematics
- Discrete Mathematics Lecture
- Discrete Mathematics Trees
- Discrete Mathematics Grade 8
- Discrete Mathematics Graf
- Discrete Mathematics Graft


