EngageNY
More Examples of Functions
Discrete or not discrete? Individuals learn about the difference between discrete and non-discrete functions in the fourth installment of a 12-part module. They classify some examples of functions as being either discrete or non-discrete.
Curated OER
Data Analysis, Probability, and Discrete Mathematics: Lesson 4
Eighth graders investigate the concepts of probability while performing data analysis. They apply statistical methods in order to measure or predict some possible outcomes. The information is collected and graphed, 8th graders analyze...
Illustrative Mathematics
Fishing Adventures 2
This resource is part of a series which expects participants to be familiar with graphing inequalities on a number line. It is a word problem that asks your class to graph a discrete solution set and interpret it in the context of an...
Curated OER
Probability and Statistics
Learners reason mathematically as they solve problems dealing with probability of an even occurring. In this probability lesson plan, students differentiate between different rankings of candidates running for leadership. They identify...
Curated OER
Organizing Data
In this organizing data worksheet, 7th graders solve seven different types of problems related to data. They first identify the type of data as categorical, discrete or continuous from the information given. Then, students use Excel to...
Curated OER
Data Analysis, Probability, and Discrete Math: Lesson 5
Eighth graders are read the material that is printed in boldface type inside the boxes. Information in regular type inside the boxes and all information outside the boxes should not be read to them. They then find the mean, median,...
Curated OER
Data Analysis, Probability, and Discrete Math: Line Graphs
Eighth graders analyze data from line graphs. They discuss the purpose of line graphs, identify the parts of a line graph, answer questions about various graphs, and complete a worksheet. This lesson includes a script to teach along with.
Curated OER
Can You Count on Cans?
How can a canned food drive be connected to math? It's as simple as counting and organizing the cans! Children demonstrate their ability to sort non-perishable foods into categories that include soup cans, vegetable cans, boxed items,...
Curated OER
An Introduction to Sequences
Fourth graders are introduced to arithmetic and geometric sequences. In this mathematics lesson, 4th graders produce a variety of sequences by varying the starting number, multiplier, and the add-on number.
EngageNY
Negative Exponents and the Laws of Exponents
Apply the properties of exponents to expressions with negative exponents. The fifth instructional activity in the series explains the meaning of negative exponents through an exploration of the properties taught in the previous lessons...
Boward County Public Schools
Hoot Activities
If you're looking for engaging, cross-curricular, inquiry-based activities and projects to support your class reading of Carl Hiaasen's Hoot, you've come to the right place!
Mathematics Assessment Project
Shelves
Don't leave this task on the shelf — use it is assess middle schoolers understanding of patterns. Participants try to discover a pattern in the number of bricks and planks used to make shelves. They then match descriptions and equations...
Curated OER
Algebra/Geometry Institute Summer 2007: Graphing Activity
Seventh graders practice identifying coordinates by examining a city map. In this graphing lesson plan, 7th graders create coordinate directions on an index card and practice locating these locations on a grid. Students read and...
Curated OER
Equivalent Fractions
Young scholars practice determining equivalent fractions using mental math skills. They play the online game "Make a Match" to select equivalent fractions sets. Afterward, they complete paper based follow up exercises.
Curated OER
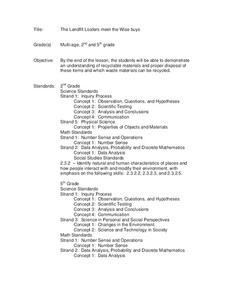
The Landfill Loafers Meet the Wise Buys
Students discover recyclable materials and the proper disposal of those items through Internet research. Working in groups of four, they search the Internet for uses of recyclable materials. After research is complete, they participate...
Curated OER
One, Two, Three...and They're Off
Students make origami frogs to race. After the race they measure the distance raced, collect the data, enter it into a chart. They then find the mean, median, and mode of the data. Next, students enter this data into Excel at which time...
Shodor Education Foundation
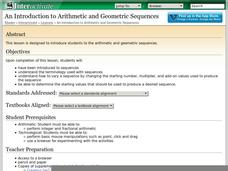
An Introduction to Arithmetic and Geometric Sequences
Help your class look for patterns as they create their own arithmetic and geometric sequences. Engage learners with an introductory discussion on sequences and use the applet to let them explore how sequences are formed. Teachers might...
Teach Engineering
Discovering Phi: The Golden Ratio
Fe, phi, fo, fum. This activity leads pairs to find the ratio of consecutive terms of the Fibonacci sequence. The pairs find that the Fibonacci sequence can be found in many places. A discussion with the class shows that the ratios found...
Curated OER
Graphs and Data
Students investigate poverty using graphs. In this algebra lesson, students collect data on the effects of poverty and use different rules to analyze the data. They graph and use the trapezoid rule to interpret the data.
Curated OER
Representing Data
Second and third graders answer questions based on data presented to them in graphs. They see how to interpret data from a bar graph, line graph, and a chart.
Curated OER
Numeric Patterns
For this numeric and visual patterns worksheet, students continue the numeric and visual patterns given to them. Students are given 16 patterns.
Curated OER
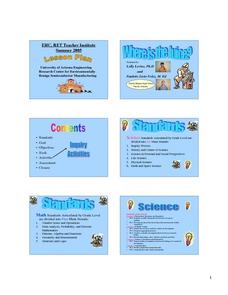
Where Is The Juice?
Students are introduced to the component's of Ohm's Law. In groups, they practice their problem solving skills by reviewing problems solved earlier. They participate in activities that help them gather information on the importance of...
Curated OER
Do You Feel Lucky?
Young scholars explore probability by using games based on probable outcomes of events. They name all of the possible outcomes of an event and express the likelihood of such an event occurring.
Curated OER
Investing
Students collect data on investments and draw conclusions. In this algebra lesson, students analyze exponential graphs as they relate to money. They discuss the cause of an account balance being high or low.


