Georgetown University
Cup-Activity: Writing Equations From Data
Determine how cup stacking relates to linear equations. Pupils stack cups and record the heights. Using the data collected, learners develop a linear equation that models the height. The scholars then interpret the slope and the...
Curated OER
Making Logic Out of Madness
Tenth graders organize and interpret data from a student health program. In this physical education lesson, 10th graders use a body composition analyzer over 8 weeks to determine the validity of a student health program. Data obtained...
Curated OER
Students Favorites
Students complete activities using a frequency table and construct a pie graph for the data. In this frequency table lesson, students complete a survey to find data for a frequency table. Students use the given link to make a pie graph...
Curated OER
Choose The Appropriate Graph
Fifth graders work in groups to investigate the proper use of a graph during a schoolyard ecology project. The challenge of the project is for students to choose the proper form of a graph. They gather data and conduct analysis with the...
Curated OER
Raw Seafood ~ On the Half Shell
The topic is fascinating, but there is not much for learners to do here. Food borne illness has always been a problem for humans to face, and here, data from the Center for Disease Control is analyzed. Learners look at the number of...
Curated OER
Tables and Data
In this tables and data worksheet, 4th graders complete word problems based on the tables and data of students recycling cans. Students complete 8 problems total.
Curated OER
Tables and Data
In this tables and data worksheet, students use a given data table to answer a set of 8 questions. A website reference for additional activities is given.
Curated OER
Data and Tables
In this data and tables worksheet, students use a given data table to answer a set of 8 questions. A website reference is given for additional resources.
Curated OER
Tables & Data
For this tables and data worksheet, 4th graders complete word problems based on a table of leaves collected. Students complete 8 problems.
Curated OER
An Alien Periodic Table
Students construct a periodic table based on the physical and chemical properties of elements. In this chemistry lesson, students share their work with the class and explain why they classified the elements that way.
Curated OER
Diagnosing Allergies Through Data Collection
Students research and organize information about allergies. In this data collection lesson, students watch a video about allergies. Students create a histogram using the information collected. Students complete the 'Displaying Survey...
Curated OER
Dice Games
Games and activities are wonderful for igniting interest in nearly any topic. With a pair of dice, your class will practice their basic math and social skills at the same time. Learners battle it out to see who can roll only odds or only...
McAuliffe-Shepard Discovery Center
Global Warming in a Jar
This well-organized lab activity introduces earth science pupils to the greenhouse effect. They will set up two experiments to monitor temperatures in an open jar, a closed jar, and a closed jar containing water. Ideally, you would have...
Curated OER
Displacement Reactions of Metals
Chemistry stars experiment with metals to observe reactivity with salt solutions. They test magnesium, zinc, iron, and copper by immersing them into different solutions and observing for changes. A separate set of data tables is...
US Environmental Protection Agency
Carbon Through the Seasons
Meteorologists view an animated video by the Environmental Protection Agency to learn how the carbon cycle works, and then move into groups to analyze and graph actual data of the atmospheric carbon dioxide concentration from Hawaii's...
Science 4 Inquiry
Edible Plate Tectonics
Many people think they can't observe plate tectonics, but thanks to GPS, we know that Australia moves at a rate of 2.7 inches per year, North America at 1 inches per year, and the Pacific plate at more than 3 inches per year! Scholars...
Serendip
Is Yeast Alive?
Through two investigations, life science learners determine whether or not yeast is alive. They perform tests for metabolism by providing sugar and observing if gas is produced as a byproduct. They incubate some of the sample for at...
Curated OER
Tables & Data
In this subtraction learning exercise, 4th graders problem solve 8 sentence subtraction word problems involving different types of birds. Students write their answers on the lines provided.
Curated OER
Freshman Project-Part 5
In this project instructional activity, 9th graders display their data, the make a graph and they answer analysis and conclusion questions on their experimental design project. They discuss the variables of their experiment, their major...
Curated OER
Science Survey
In this science survey worksheet, students think of a survey question to give to their classmates, create a data table to record responses, and then graph the results to their question. This worksheet has 4 fill in the blank questions...
Curated OER
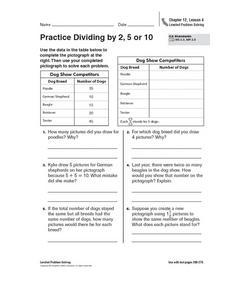
Practice Dividing by 2, 5, or 10
In this pictograph problem solving worksheet, students analyze the data on a table and create a pictograph. Students read and solve 6 story problems about the pictograph.
Curated OER
Probability
For this probability worksheet, 8th graders solve and complete 15 different problems related to determining the probability of various events. First, they complete the table illustrated on the sheet. Then, students use the table to...
Curated OER
Line Graphs
In this line graphs activity, 8th graders solve and complete 20 different problems that include reading various line graphs. First, they use the information provided in each line graph to determine the correct response to each of the...
Curated OER
Organizing Data
In this statistics activity, 11th graders collect data and organize it using a frequency table. They plot their data and analyze it using stem and leaf plots. There are 3 questions with an answer key.


