Balanced Assessment
Multi-Graphs
So many things change as time goes by. Here, scholars create graphs based on this premise. Each problem asks pupils to sketch a graph that describes a given situation. Their graphs represent various characteristics such as height,...
Concord Consortium
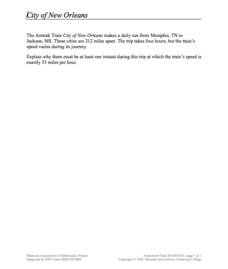
City of New Orleans
In the United States, most trains operate at a top speed of 100 miles per hour. Scholars use information on the distance and time of a train trip to determine if the train ever reaches a specific speed. They connect pieces of information...
Mathematics Assessment Project
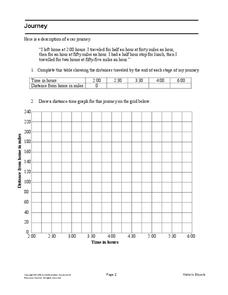
Journey
Drive home math concepts with an engaging task. Learners follow a verbal description to fill in a table and create a distance-time graph representing a car journey. They then answer questions by interpreting the graph.
Corbett Maths
Area under a Graph
What? The calculation of area is a linear distance? A short video shows how to use the areas of simple polygons to estimate the area under a graph. Pupils divide the area under a curve into figures to easier calculate the area. Given...
101 Questions
Slow Church
The church that just can't stay put! A video presentation raises questions of just how far the church will move. Presented with the rate of movement and a range of time expected, scholars build an inequality to answer the question.
K5 Learning
Mixed Practice Word Problems #12
Five questions make up a mixed practice worksheet consisting of word problems that cover subtraction, multiplication, pounds, and distance.
Curated OER
Lesson #20 Rates of Change and Velocity
Students investigate speed. In this rate of change lesson, students complete a rate/time/distance table to determine the average m.p.h. of a given trip. They listen and follow along with the lecture and examples to determine the average...
Curated OER
Chapter 10 - Objective 4.1 - Distance
In this distance worksheet, students solve equations involving square roots. They use the distance formula to solve four of the ten problems. This one-page worksheet contains ten problems.
Curated OER
Travel Time
Students use a migration map to estimate the distance traveled by a bird while migrating south. After calculating accurate estimates of the distance traveled, students compare the distances traveled with the amount of time elapsed.
Curated OER
Reaction Time
Young scholars investigate their reaction times for grabbing a dropped ruler after discussing reactions times to other events such as moving your foot from the gas pedal to the brake. They drop the ruler from a sent height and record the...
Curated OER
Hot Wheelin' Physics
In this physics worksheet, students complete a lab activity and record their results in the charts shown. They calculate the speed for each trial using the total time and total distance. Students also graph their results.
Curated OER
Horatio's Ratios
View a PBS video entitled Horatio's Drive and explore Horatio's Ratios. Collaborative learners form groups to use Mapquest to determine distances covered. They generate the mathematical averages, ratios, and rates in order to calculate...
Curated OER
Nascar Unit Activity 2
Eighth graders divide into groups of 4 or 5. They go to the track and have every student run/walk one lap around the school track. Call out their times as they cross the finish line. In the computer lab, have the students create a table...
Curated OER
How Fast is it Traveling?
Learners calculate the rate of speed of various moving objects within the classroom setting, or outside under a controlled environment.
101 Questions
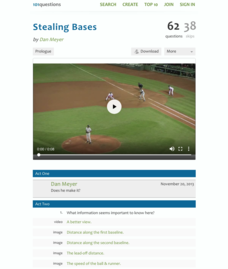
Stealing Bases
And he's ... safe? ... out? It's up to your scholars to decide! Provided with the speed of the runner and ball, learners develop a plan to determine which reaches the base first, the ball or the runner. While the distance from home to...
101 Questions
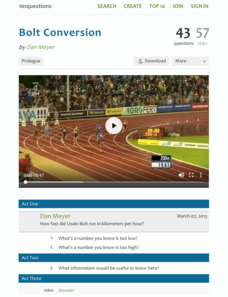
Bolt Conversion
Usain Bolt and Superman have something in common—speed! A video of one of Bolt's races introduces young scholars to the concept of unit rate. Using data from the race, the narrator calculates a unit rate in kilometers per hour, which...
Curated OER
Move My Way: A CBR Analysis of Rates of Change
Learners match a given velocity graph and sketch the corresponding position graph using a graphing calculator. After collecting data from their everyday life, learners use specific functions on their calculators to create graphs and...
Curated OER
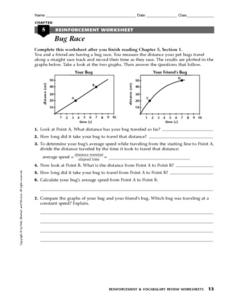
Bug Race
In this motion learning exercise, students compare two graphs showing a bug's distance traveled over time. Students calculate the average speed of the bugs and determine which bug was traveling at a constant speed. This learning exercise...
Curated OER
The Train and Bee Problem
In this problem solving activity, students solve 1 word problem about two trains and a bee traveling towards each other. Students determine the distance traveled by the bee given velocity of the trains and bee, and the distance between...
Noyce Foundation
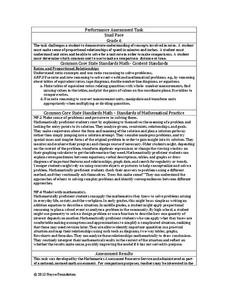
Snail Pace
Slow and steady wins the race? In the assessment task, scholars calculate the rates at which different snails travel in order to find the fastest snail. Hopefully, your class will move much more quickly in finishing the task!
Curated OER
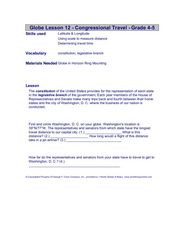
Congressional Travel
Students determine the distances traveled by the members of the legislative branch of the US Government. In this travel distance lesson, students locate Washington, DC on a globe using the longitude and latitude of the city. They...
Curated OER
Worksheet 15: Velocity
In this velocity worksheet, students read story problems, write equations and determine distance, velocity and time. They derive an equation for the function. This two-page worksheet contains seven multi-step problems.
Curated OER
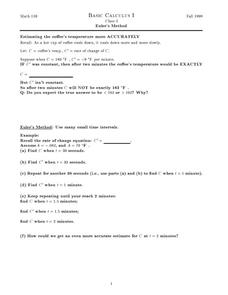
Euler's Method
In this Euler's method activity, students use Euler's method to determine one-second time intervals in a rate problem. They explore functions to estimate rate changes in small time intervals. This two-page activity contains...
Curated OER
Worksheet 16
In this math worksheet, students compute the total distance traveled for a car moving in a straight line at 45 mph for 2 hours. Then they compute the distance for a car moving along a curved path at 45 mph for 2 hours.
Other popular searches
- Distance Rate Time Problems
- Distance Rate Time Formula
- Distance Rate Time Graphing
- Rate Time Distance Equation
- Rate Time Distance
- Rate, Time, Distance Problems


