National Council of Teachers of Mathematics
Varying Motion
For this secondary mathematics learning exercise, high schoolers collect data based on a person’s motion. From this data, students create graphs comparing displacement, velocity, and acceleration to time. The five-page learning exercise...
Curated OER
Speed and Distance
In this speed worksheet, learners create time vs. distance graphs to answer questions about average speed, average velocity, and acceleration. This worksheet has 3 problems to solve.
Curated OER
Take a Walk
Sixth graders graph acceleration and practice using the metric system. In this physics lesson, 6th graders take turns timing each other as they walk 15 meters. Students then chart and graph their data using the metric system.
Curated OER
One, Two, Three...and They're Off
Students make origami frogs to race. After the race they measure the distance raced, collect the data, enter it into a chart. They then find the mean, median, and mode of the data. Next, students enter this data into Excel at which time...
Curated OER
Acceleration and Average Speed
In this acceleration and average speed worksheet, students learn the equations for acceleration and average speed. They match 6 variables with their quantities, they identify speed vs. velocity and scalar vs. vector and they solve 4...
Noyce Foundation
Truffles
Knowing how to scale a recipe is an important skill. Young mathematicians determine the amount of ingredients they need to make a certain number of truffles when given a recipe. They determine a relationship between ingredients given a...
Alabama Learning Exchange
Jump! An Exploration into Parametric Equations
Explore parametric equations in this lesson, and learn how to determine how much time it takes for an object to fall compared with an object being launched. high scoolers will use parametric equations to follow the path of objects in...
Curated OER
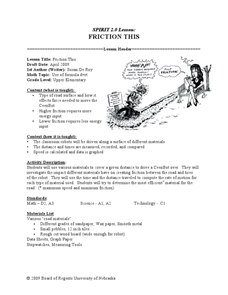
Friction This
Students investigate road surface and calculate speed. In this algebra instructional activity, students analyze the roughness of a road and calculate distance and speed based on friction. They relate friction and energy to speed.
Illustrative Mathematics
Walk-a-thon 2
During a walk-a-thon your learners must determine the walking rate of Julianna's progress. Using tables, graphs, and an equation, they must be able to calculate the time it took her to walk one mile and predict her distance based on the...
Illustrative Mathematics
Walk-a-thon 1
Your mathematician's job is to explore the relationship between hours and miles walked during a walk-a-thon. The activity compels your learners to experiment with different means in finding out this proportional relationship. The answer...
Kenan Fellows
Analyzing Speed from Different Modalities
Show us your moves. Using sensor equipment, scholars track the motion of different movements, such as jogging, skipping, or jump roping. They analyze velocity and acceleration and create graphs representing each movement.
Curated OER
Reading Fluency
Aid readers in achieving fluency! Hone in on appropriate pacing, accurate pronunciation, and varied intonation through modeling and ample practice. In one-minute bursts, individuals rehearse reading a passage aloud, recording where they...
Science Matters
Finding the Epicenter
The epicenter is the point on the ground above the initial point of rupture. The 10th lesson in a series of 20 encourages scholars to learn to triangulate the epicenter of an earthquake based on the arrival times of p waves and s waves....
NASA
Measuring Dark Energy
You're only 10 minutes late? Do you know how much the universe has expanded in those 10 minutes? Scholars graph supernovae based on their redshift and see if the results verify Hubble's Law. If it does confirm it, the universe is...
Curated OER
Walking Home
Middle schoolers discover the formulas for calculating distance. In groups, they solve equations determine the distance in a specific amount of time. They record their answers in a chart or graph and compare them with their classmates.
Curated OER
Marble Madness
Middle schoolers determine the velocity of a marble rolling down the incline. In this physics lesson plan, students identify the independent and dependent variables in the experiment. They construct and analyze a graph.
Curated OER
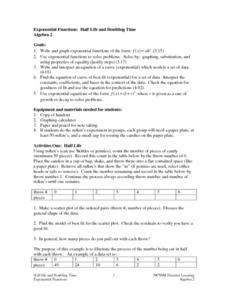
Exponential Functions: Half Life and Doubling Time
Students investigate the concept of exponential functions and how they increase in size over time. They simplify the functions in order to find the solutions that are possible and perform analysis of the curved line that is produced when...
EngageNY
End-of-Module Assessment Task: Grade 8 Module 4
Connect proportional linear equations and systems. The seven-question assessment is the last installment in a 33-part series. The items cover comparing proportional relationships, slope concepts, and simultaneous linear equations. To...
Curated OER
Quadratic Equations and Functions
This comprehensive lesson plan reviews solving and graphing quadratic functions and functions of higher degree. Using the vertex form of a quadratic functions, one finds the vertex, minimum or maximum, and axis of symmetry. A few word...
Curated OER
How Does Your (Coral) Garden Grow?
Analyze and graph oxygen isotope ratios in coral samples in relation to the distance from the outer skeleton edge. Compare the data to the mean monthly water temperatures. Uncover whether or not there is any correlation. In addition to...
Curated OER
The Tortoise And The Hare
Students use the children's story of The Tortoise And The Hare in order to investigate the graphing of equations. The story is converted to an algebraic word problem for them to solve. Students investigate the relationships of data and...
EngageNY
Increasing and Decreasing Functions 2
Explore linear and nonlinear models to help your class build their function skills. In a continuation of the previous lesson, learners continue to analyze and sketch functions that model real-world situations. They progress from linear...
Curated OER
A Steep Hike
Students explore slope. In this middle school mathematics lesson plan, students analyze and interpret graphs as they investigate slope as a rate of change. Students use a motion detector to collect data as they walk at different speeds...


