Virginia Department of Education
Functions: Domain, Range, End Behavior, Increasing or Decreasing
Examine key features of various functions through exploration. A comprehensive lesson has learners describe the domain, range, end behavior and increasing/decreasing intervals of various functions. Function types include linear,...
Curated OER
Using Graphs
Print and use this useful unit on basic algebraic functions, domain, range, and graphing. Tasks include, illustrating simple functions with a graph, and identifying the domain and range of the function. This twelve-page packet contains...
Curated OER
Domain and Range
Relations, and functions, and line tests, oh my! An instructional slideshow demonstrates the definitions of a relation, a function, and the domain and range of a relation. Viewers then learn how to use mappings and vertical...
West Contra Costa Unified School District
Key Features of Graphs
The key is ... After a day of instruction on key features of graphs, groups create a poster and presentation on the key features of their given function graph. The resource provides an extension activity of "telephone" using...
CK-12 Foundation
Analyzing the Graphs of Functions: Analyzing a Rational Function
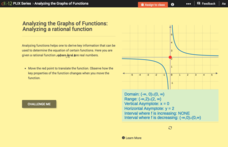
Shift the function and transform the key features of the graph. By translating the graph of the rational function, class members find out how the key features alter. Pupils determine the domain, range, asymptotes, and intervals of...
Embedded Math
Trig Graph
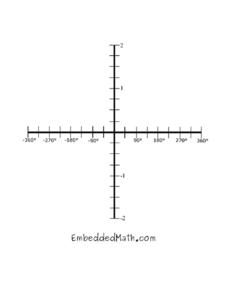
You and your learners will enjoy having many copies of this trigonometric graph set on the Cartesian coordinate grid with a domain running from -360 degrees to 360 degrees and a range running from -2 to 2.
Curated OER
Graphs
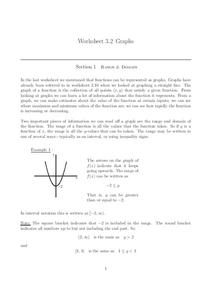
In this graphs activity, students solve and complete 15 various types of problems. First, they determine the range of the function of the graph shown and write in interval notation. Then, students find the domain of the function in the...
Flipped Math
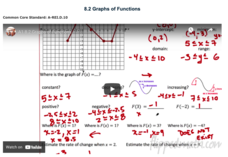
Graphs of Functions
Create a graphical description. Pupils watch a video presentation starting with vocabulary on properties of a graph of a function and then use the vocabulary to find key features of graphs of a function. Scholars use three graphs in the...
Curated OER
Graph, Identify Asymptotes, Find Domain and Range, for Eleven Simple Rational Functions
Using this worksheet, pupils graph 11 simple rational functions. They also find asymptotes, domain, and range for each function. The solutions are provided.
Houston Area Calculus Teachers
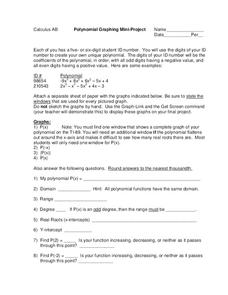
Polynomial Graphing
Your AP Calculus learners probably have their ID numbers memorized, but have they tried graphing them? Pique your pupils' interest by asking each to create a unique polynomial function based on their ID numbers, and then analyze the...
EngageNY
Graphing the Tangent Function
Help learners discover the unique characteristics of the tangent function. Working in teams, pupils create tables of values for different intervals of the tangent function. Through teamwork, they discover the periodicity, frequency, and...
Curated OER
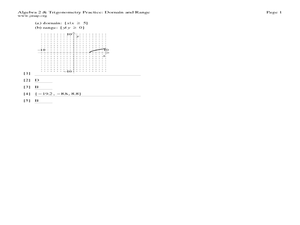
Domain and Range
In this domain and range worksheet, students write the definitions for relation, function, domain and range. They then find the domain and range of 7 sets of ordered pairs. Finally, students answer 4 questions regarding inverse relations...
Curated OER
Graphs and Transformations of Functions
Is it possible to solve quadratic equations by factoring? It is, and your class will graph quadratic equation and functions too. They perform transformation on their graphs showing increasing and decreasing intervals, domain, and range....
Texas Instruments
Graphs of Rational Functions
Take your kids on a tour of graphing rational functions. Using this TI lesson, high schoolers identify the end behavior of their functions. They find the domain and range, describe end behavior, and look at asymptotes and restrictions of...
Curated OER
Domain and Range: Equation
In this algebra worksheet, students state the domain and range of various functions and equations. There are five questions and some are multiple choice questions.
CPM
Tables, Equations, and Graphs
Eighth and ninth graders solve and graph 24 different problems that include completing input/output tables and graphing the pairs. First, they find the missing values for each table and write the rule for x. Then, learners write the...
CK-12 Foundation
Restricted Domain and Range: Translation of a Curve
Moving the graph of a function obviously changes its domain and range. Scholars adjust the location of a graph in an interactive coordinate plane. The interactive automatically updates and displays the domain and range to show how it...
Kenan Fellows
Reading Airline Maintenance Graphs
Airline mechanics must be precise, or the consequences could be deadly. Their target ranges alter with changes in temperature and pressure. When preparing an airplane for flight, you must read a maintenance graph. The second lesson of...
Coastal Carolina University
Graphs of the Six Trigonometric Functions
Your learners will appreciate having this color-coded set of the six trigonometric functions all on one page. Included are the graphs for sine, cosine, tangent, cosecant, secant, and cotangent. Notice that part of each graph is...
Mt. San Antonio Collage
Quiz 1: Functions, Domain and Range
Take the work out of worksheets and use these problems and worked-out answer key as a resource. The problems reinforce skills in domain and range, identifying graphs, and even and odd functions.
Curated OER
Algebra 2 Desmos Graphing Project
Encourage class members to get creative with functions. Pairs write their names and draw pictures using a graphing application with a collaborative graphic project. The resource provides the requirements for the project, as well as a...
EngageNY
Graphing the Logarithmic Function
Teach collaboration and communication skills in addition to graphing logarithmic functions. Scholars in different groups graph different logarithmic functions by hand using provided coordinate points. These graphs provide the basis for...
University of North Texas
Reading Graphs
There is more to the eye than just a graph on paper. The presentation shows three different piecewise graphs and asks an assortment of questions. The resource includes topics such as domain and range, intervals of increasing and...
EngageNY
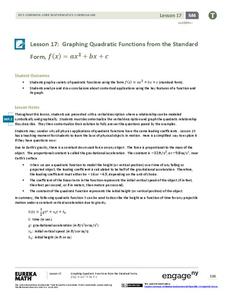
Graphing Quadratic Functions from the Standard Form
Use context to explain the importance of the key features of a graph. When context is introduced, the domain and range have meaning, which enhances understanding. Pupils use application questions to explore the key features of the graph...


