Curated OER
Domain and Range
In this domain and range worksheet, students solve and complete 5 different sets of problems. First, they find the domain and range of each of the given functions. Then, students determine whether each of the functions is odd, even or...
Curated OER
Domain and Range
In this domain and range worksheet, students examine graphs and find the domain and range of each function. This one-page worksheet contains 6 problems.
Curated OER
Easy Worksheet: Domain and Range
In this domain and range worksheet, students solve 4 short answer problems. Students find the domain and range of various functions given an equation, table of values, or graph.
Curated OER
Graphing at all Levels: It's a Beautiful Thing!
Mixing math and art is done in this lesson by applying graphing knowledge to create a unique piece of art. This lesson varies acording to the graphing knowledge of the artist. First, learners identify and review various types of graphing...
Mt. San Antonio Collage
Test 1: Functions and Their Graphs
Save the time creating an assessment because these function problems should do the trick. With 10 multi-part questions, they each focus on a different topic including radical, polynomial, linear and piecewise functions. The majority of...
Curated OER
Profitable Soda Stand
Am I making any money? Help learners determine if their fictitious soda stand is turning a profit. They graph linear equations using the slope and y-intercept and identify the best price to use to sell soda. They identify the domain and...
Curated OER
Domian and Range of Graphs
High schoolers determine the domain and range of various graphs using a graphing calculator. Given a set of graphs to analyze, learners calculate the range and domain of the graphs by plotting the graphs on their calculators. Downloads...
Curated OER
Mathematical Modeling
Study various types of mathematical models in this math lesson. Learners calculate the slope to determine the risk in a situation described. They respond to a number of questions and analyze their statistical data. Then, they determine...
Curated OER
Graphing Rational Functions
For this Algebra II worksheet, 11th graders graph rational functions and use the graph to solve real-life problems. The four page worksheet contains forty-one problems. Answers are not provided.
EngageNY
Secant and the Co-Functions
Turn your class upside down as they explore the reciprocal functions. Scholars use the unit circle to develop the definition of the secant and cosecant functions. They analyze the domain, range, and end behavior of each function.
Mathematics Vision Project
Quadratic Functions
Inquiry-based learning and investigations form the basis of a deep understanding of quadratic functions in a very thorough unit plan. Learners develop recursive and closed methods for representing real-life situations,...
Flipped Math
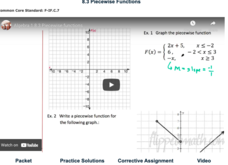
Piecewise Functions
Break it up into pieces to solve the problem. Individuals watch a video on how to graph and determine the equation and values of piecewise functions. Viewers then work several exercises to practice evaluating a piecewise function at...
Mathematics Vision Project
Features of Functions
What are some basic features of functions? By looking at functions in graphs, tables, and equations, pupils compare them and find similarities and differences in general features. They use attributes such as intervals of...
Curated OER
Intersecting Graphs
Ninth graders know how to solve a system of linear equations, but what happens when the system involves an exponential function? The instructional slideshow teaches viewers to determine solutions to systems of equations with linear...
Curated OER
Graphing Review
in this graphing review worksheet, students solve a variety of problems such as interpreting parabolas, identifying intercepts and asymptotes, and identifying functions. They solve piecewise functions and rational functions. This twenty...
Curated OER
Quiz: Logarithmic Functions
Explore logarithmic functions, and have pupils solve 10 different problems that include various logarithmic functions. First, they find the domain of a given function and then the range. They also consider a graph that has a limited...
Curated OER
Algebra I: Linear Functions
Using rates from a rental car company, young mathematicians graph data, explore linear relationships, and discuss the role of slope and the y-intercept. This lesson plan allows for the discussion of independent and dependent variables,...
Curated OER
Calculus 30 - Typical Exam Questions
In this limits and functions instructional activity, students solve 30 short answer questions about calculus Students find limits, domain, range, tangent lines, derivatives, and composition functions.
Curated OER
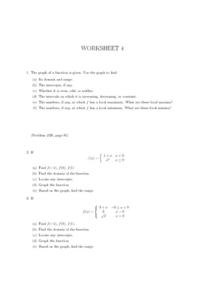
Worksheet 4, Functions
Eighth and ninth graders graph a given function and identify the domain, range and intercepts. Theytell the intervals that the function is increasing, decreasing, or constant. Pupils identify the minimum and maximum of the graph, and...
Curated OER
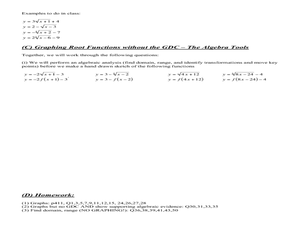
Graphing Radical Functions-A Graphic Introduction
In this Algebra II worksheet, 11th graders graph root functions and analyze the domain, range, intercepts, maximum and minimum values, and end behavior. students use that information to transform the graphs of root...
University of North Texas
Graphing Piecewise Functions
Piecewise functions are the hodge-podge of algebra. Here, pupils watch as each graph is created and then pieced together to make a function. The first example creates a graph step-by-step, while the second problem posts a graph...
Mathematics Vision Project
Module 5: Features of Functions
The language and features of functions get careful treatment in a complex but doable lesson. Learners get a lot of practice really figuring out what a graph means in context, and also identifying key features of graphs. Key ideas...
Illustrative Mathematics
Transforming the graph of a function
This activity guides learners through an exploration of common transformations of the graph of a function. Given the graph of a function f(x), students generate the graphs of f(x + c), f(x) + c, and cf(x) for...
Curated OER
Graphing Inequalities in Two Variables
This study guide is a great resource to help you present the steps to graphing linear inequalities. Show your class two different ways to graph an inequality and work on a real-world example together. The document could also be easily...


