Curated OER
Plate Patterns
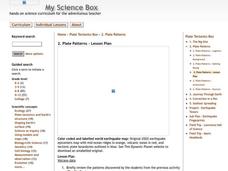
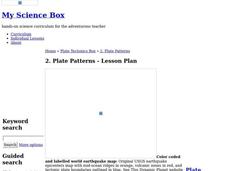
Students read about a volcano and use the latitude and longitude information to plot and describe the volcano on the map. They discuss patterns seen on the map. In addition, they color code a map according to zones, plates, etc.
Curated OER
Intro to the Coordinate Plane
Students identify the axes, quadrants of the coordinate plane and plot points on the plane. They take notes on the coordinate plane. Students and teacher go over examples of the coordinate plane. As an independent practice students...
Curated OER
Trends in the Periodic Table
In this trends in the periodic table learning exercise, high schoolers plot the ionization energy vs. atomic number and they plot atomic radius vs. atomic number of the first 20 elements. Students analyze their graphs and answer...
Curated OER
Organizing Data
In this statistics worksheet, 11th graders collect data and organize it using a frequency table. They plot their data and analyze it using stem and leaf plots. There are 3 questions with an answer key.
Curated OER
Coordinate Plane
In this algebra worksheet, students investigate the coordinate plane through graphing, plotting and identifying the different quadrants. They identify vertical and horizontal lines in the coordinate plane. There are 10 questions with an...
Curated OER
Minerals and the Products of Mining
Students plot where minerals come from and have an awareness of how mineral use makes the world interdependent. They examine how to identify some sort of mineral products they use each day.
Curated OER
Coordinates
In this coordinates worksheet, students analyze two maps and identify the coordinates of ten specific locations. Students plot sixteen points on a graph and check their answers online at the end of each exercise.
Curated OER
The Solar Neighborhood within 17 Light Years!
For this distance between stars worksheet, learners plot the distance between the sun and 11 other stars on a 2 dimensional grid using a protractor and a ruler. They determine the distances between various stars and they find the...
Curated OER
Complete Metamorphosis
Pupils use a map and colored pins to plot the migration path of Monarch butterflies. They use data found at the Journey North website. Commas are also used in the activity to show how they are put in a series of words using butterfly...
Curated OER
Looking Normal
Students identify the shape of a function. In this statistics lesson plan, students plot the data collected. They analyze their data for positive, negative or no correlation. They find the line of best fit.
Curated OER
Earthquake Plotting
Students become familiar with map coordinates. They establish the frequency of earthquake occurrences and study the location and magnitude of earthquakes. To establish the location of plate boundaries.
Curated OER
What in the World?
Eighth graders plot points of longitude and latitude on a world map. In groups, they create a model of the earth's interior and label the parts,
Curated OER
Making an Alien Mask Using Coordinate Pairs
In this math worksheet, students create an alien mask and practice graphing coordinate pairs. Students follow the directions to plot coordinates on an x and y axis. When they are finished students will see an alien face which can be made...
Curated OER
Plate Patterns
Students review the patterns they discovered from a previous activity. In this investigative lesson students plot data as a class and color a map.
Curated OER
What Is That Bubblin¿¿¿ In My Back Yard?
Students create a map plotting local sites the Environmental Protection Agency has on its EPA Regulated Sites list. They discuss the need for citizens to, at a minimum, be aware of potential pollution hazards in their community.
Curated OER
Latitude Longitude
In this latitude and longitude worksheet, students plot 39 latitude/longitude locations on a graph, connecting the dots as they go along.
Curated OER
Latitude Longitude
In this latitude and longitude activity, students plot 34 latitude/longitude locations onto a graph, connecting the dots as they go along.
Curated OER
The Geography of the Olympics
Students plot the location of the Winter and Summer Olympics since 1896. Using the maps, they analyze data on where the Olympics have been held and discuss why that location was chosen. They discuss the possiblity of Indianapolis...
Curated OER
Constellation Lab
In this constellation worksheet, students plot given constellations and stars on a map and color code each. They answer questions about the constellations they plot.
Curated OER
Scientific Observation of Force and Acceleration on an Object
In this force and acceleration worksheet, 8th graders answer ten questions based on two graphs. The first graph is a scatter plot, the second is a line graph.
Curated OER
Graphing Inequalities
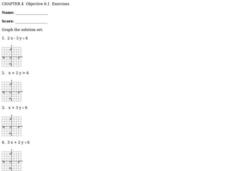
In this graphing inequalities worksheet, students solve and graph the solution set for eight inequalities. They first solve each inequality, either for x or for y, then they plot the coordinates found on the graph provided for each...
Curated OER
Function-al Machines and Spaghetti Graphs
Sixth graders identify the relationship between patterns and functions. For this algebra lesson, 6th graders use a "Functional Machine" to identify the rule. Students use a function table to plot the points using play dough dots.
Curated OER
Measures of Central Tendencies: Quartiles
In this statistics worksheet, students calculate the mean, median, mode, range, lower quartile, and upper quartile for 10 questions and interpret a box and whiskers graph.
Curated OER
Points In the X-Y Plane
Students plot points on the x-y plane using x and y coordinates and describe how the x and y values relate to the position of the point on the plane. They plot points that fit a linear relationship. They explain that their horizontal and...


