Curated OER
Giant Mystery
Third graders determine the relationship between hand size and body size using centimeters as the unit of measure, They use the relationship to find the size of a hypothetical giant. They graph the measurements using a spreadsheet program.
Curated OER
Decisions, Decisions, Decisions
Students examine graphs to find the most appropriate for various kinds of data. In this graphing instructional activity, student create bar, line and circle graphs. Students create graphs electronically and manually interpreting the data.
Willow Tree
Graphing
So many methods and so little time! The efficient method of graphing a linear equation depends on what information the problem gives. Pupils learn three different methods of graphing linear equations. They graph equations using...
Curated OER
Review Graphing Parabolas & Circles
Students review how to graph parabolas. They practice graphing two different parabolas using the vertex and table method. They solve problems related to graphing circles, determining the radius and the center.
Math Sphere
Co-Ordinates
Challenge young mathematicians' understanding of the coordinate plane with this series of skills practice worksheets. Offering 10 different exercises that involve identifying ordered pairs, graphing polygons, and rotating/reflecting...
Curated OER
Earthquakes: Sixth Grade Lesson Plans and Activities
Young seismologists learn more about plate tectonics with a set of pre-lab, lab, and post-lab lessons plans on earthquakes. After exploring how waves travel through various materials, sixth graders record their observations and draw...
West Contra Costa Unified School District
Solving Inequalities
What does translating points on a number line have to do with solving inequalities? Young mathematicians first learn about translations of points on a number line, and then use this information to solve linear inequalities in one variable.
All for KIDZ
The Orphan of Ellis Island
Everyone comes from somewhere. An interdisciplinary lesson on Elvira Woodruff's The Orphan of Ellis Island includes discussion starter and writing prompts for the novel, as well as a graphic organizer to help learners begin their own...
Curated OER
Measure of Spread
Students identify the standard deviation. In this statistics lesson, students find the mean distribution and calculate the percent of deviation from the mean. They observe this change on the Ti calculator.
Curated OER
Sampling Distributions
Students analyze sampling from different population. In this statistics activity, students define the meaning of sample sizes and what causes an increase or decrease. They graph their data on the Ti calculator and draw conclusion from...
Curated OER
The Giver
Tenth graders identify the different ideas, emotions that different colors represent the significance of color in real life. They examine the significance of the lack of color in The Giver and the movie Pleasantville. They develop...
Curated OER
Peer and Self-evaluation in Spoken Tests: Tools and Methods
Students, in groups, each take a different role and are to either ask or answer questions. They explore how to effectively evaluate themselves and others.
Curated OER
Basic Algebra and Graphing for Electric Circuits
In this electronics activity, students evaluate mathematical expressions to complete 16 short answer and problem solving questions.
Curated OER
Asteroids Between Mars and the Sun
In this asteroids of the solar system worksheet, students observe a diagram showing all the minor planets found in the orbit of Mars. Students answer 4 questions about the minor planets inside the orbit of other planets, they find the...
Curated OER
Algebra: Reaching New Heights
Students work in pairs to measure their arm span and height and record them on a class chart. The class works together to create a scattergram to display the data. Class discussion focuses on interpreting the scattergram.
Curated OER
Fitting Periodic Functions-Distant Planets
In this periodic functions instructional activity, students use given data of the speed of a star and find the best fit periodic function that follows the trend in data. They determine the amplitude, offset phase and the formula for the...
Curated OER
Energy, Work and Power
In this energy, work and power worksheet, students solve 12 problems about circuits, electric motors, Ohm's Law and electric currents.
Curated OER
Give Me A Break!
Students create and conduct a survey. In this broken bones lesson, students discuss if they've ever broken a bone and how a broken bone heals. Students generate questions for a survey on broken bones and healing time, conduct the survey...
Curated OER
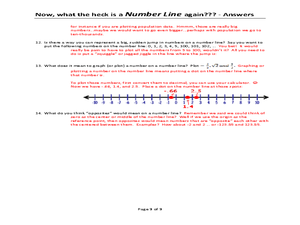
Now, what the heck is a NUMBER LINE again???
A unique approach to reviewing number lines and how to locate different values on them, this worksheet poses several questions that require written answers rather than calculations. You could use this as a note-taking guide when teaching...
Curated OER
Tag It and Bag It: Archeology Lab Lesson
Seventh graders practice analyzing, collecting and categorizing artifacts. Using charts, they organize and interpret information about the artifacts they classified. They work together to create a graph to represent class totals and...
Curated OER
Grasshopper Mark and Recapture (GMR)
Students estimate the density of a population of insects (grasshoppers) at a given life cycle stage in a given type of habitat.
Curated OER
Basic Algebra and Computers: Spreadsheets, Charts, and Simple Line Graphs
Students, while in the computer lab, assess how to use Microsoft Excel as a "graphing calculator." They view visual representations of line graphs in a Cartesian plane while incorporating basic skills for using Excel productively.
Curated OER
Number Sense and Operations
In this number sense and operations worksheet, students solve 15 different problems that include number lines and identifying various types of numbers. First, they solve a given equation and then check their work. Then, students find the...
Curated OER
Explore Learning - Mean , Median and Mode Gizmo
Sixth graders experiment with mean, median, and mode. In this online interactive mean, median, and mode lesson plan, 6th graders analyze the results of multiple experiments and after they work in groups completing the median, mode, and...


