Curated OER
Learning Lesson: Analyzing a Weather Map
Learners use weather maps to locate warm and cold fronts. They discover the different types of weather associated with these fronts. They also observe the weather in their local area.
Curated OER
Chart problems involving car defects and customer service departments
In this interactive worksheet, students solve two problems using the charts provided. Students must convey they are able to understand charts and how to read them.
Curated OER
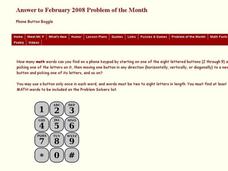
Phone Button Boggle
In this phone button boggle worksheet, learners identify the number of math words they can find on a phone keypad according to given directions. This one-page worksheet contains one problem. Answers are provided.
Curated OER
Graphing Parabolas and Circles
Students graph parabolas and circles. For this algebra lesson, students create a table of values and graph the coordinate pairs to create a graph. They graph a circle using the radius and center.
Curated OER
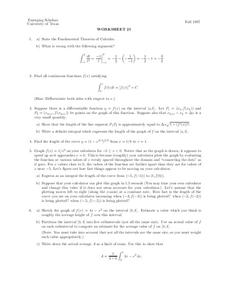
Worksheet 25
In this math worksheet, learners state the Fundamental Theorem of Calculus. Then they evaluate the functions and test them against the theorem.
Curated OER
Data and charts
In this data and charts activity, students answer multiple choice questions referring to different charts about mountain heights, breakfast drinks, and more. Students complete 10 multiple choice questions.
Curated OER
Earth and Space Science: Exploring Earthquakes
Students explore earthquakes. In this earthquake instructional activity, students research earthquakes and identify where they take place. Students use map skills to track down earthquake locations. There are internet sites suggested in...
Curated OER
Exploring Area/Perimeter Through Coordinate Geometry
Students explore area and perimeter through coordinate geometry using student literature, hands-on manipulatives, and the Internet.
Curated OER
Making Connections
Eighth graders investigate the input/output model for building function tables. From the data, 8th graders connect tables, graphs, function rules, and equations in one variable. They work backwards to determine function rules for given...
Curated OER
MA 439-Math of Image Processing
In this image processing worksheet, students use a matrix to solve ten problems. For the first six problems, students are guided to the answer by carefully sequenced questions. The final four problems require students to make a series of...
Curated OER
Portraits of Courage
Seventh graders define courage and illustrate it in a portrait art medium. In this courage and art lesson, 7th graders discuss courage and identify a person who represents its meaning. Students then bring in a visual image of the subject...
Curated OER
Table Readings
In this table worksheet, students read questions and interpret tables. Questions include information concerning unemployment, oil imports, and foreign students. This multiple-choice worksheet contains 10 problems. Answers are provided.
Curated OER
The Correlation Between Human Population Growth and Dwindling Natural Resources
Eighth graders predict human population growth. In this lesson, 8th graders discuss the length of time needed to double the human population, work in groups to chart population growth and predict population growth in the...
Curated OER
How Does Climate Affect Your Environment?
Learners access the Global Sun Temperature Project website and research the relationship between the location and climate of a participating school to its building structure. They consider how climate affects the type of structures...
Curated OER
Big Apple, Here We Come
Students role play the role of immigrants coming to America for the first time. They complete an imaginary trip with their family and must rent a car and make seven stops along the way. They calculate distances and use maps to...
Curated OER
Track's Slippery Slope
Middle schoolers graph data of sports figure running time using x-axis y-axis to find slope of trend line, mathematically find the interpolated and extrapolated values for data points. Using the information they make predictions.
Curated OER
Trends in Precipitation
Eighth graders study about precipitation and graph the information. They look for patterns in a scatter graph and make inferences based on what they see. They need to see a relationship between location and the amount of precipitation.
Cuemath
Cuemath: Dot Plot
A comprehensive guide for learning all about dot plots with definitions, how to construct them, solved examples, and practice questions.
Khan Academy
Khan Academy: Creating Dot Plots
Practice creating dot plots. Dot plots are very similar to frequency tables, but they make it easier to see the data. Students receive immediate feedback and have the opportunity to try questions repeatedly, watch a video or receive hints.
Texas Instruments
Texas Instruments: Birthday Dot Plots
Using TI-Navigator, students' cursors become dots for a dot plot of what month they were born in.
Khan Academy
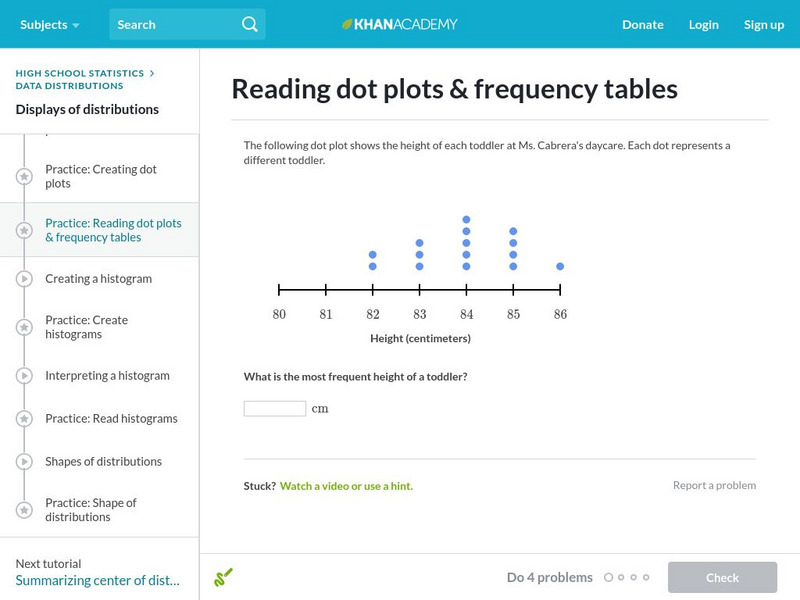
Khan Academy: Reading Dot Plots and Frequency Tables
In this exercise, students practice reading dot plots and frequency tables. Students receive immediate feedback and have the opportunity to get hints and try questions repeatedly.
Khan Academy
Khan Academy: Reading Dot Plots & Frequency Tables
Practice reading basic dot plots and frequency tables. Students receive immediate feedback and have the opportunity to try questions repeatedly, watch a video or receive hints.
Khan Academy
Khan Academy: Dot Plots and Frequency Tables Review
Dot plots and frequency tables are tools for displaying data in a more organized fashion. In this article, we review how to make dot plots and frequency tables.
Quia
Ixl Learning: Dot Plots
Brush up on your math skills relating to dot plots then try some practice problems to test your understanding.


