Beyond Benign
Plastic Bags
Paper or plastic? Explore the environmental effects of using plastic bags through mathematics. Learners manipulate worldwide data on plastic bag consumption to draw conclusions.
Curated OER
Fish Communities in the Hudson
Learning to read data tables is an important skill. Use this resource for your third, fourth, or fifth graders. Learners will will study tables of fish collection data to draw conclusions. The data is based on fish environments in the...
Curated OER
The Fabled Maine Winter
Learners graph and analyze scientific data. In this research lesson plan students use the Internet to obtain data then draw conclusions about what they found.
Curated OER
Cold, Clouds, and Snowflakes
Students explore satellite data and graphing. In this weather data analysis math and science lesson, students analyze NASA satellite data to draw conclusions about geographical areas where precipitation might have happened. Students...
Curated OER
Using MY NASA DATA to Determine Volcanic Activity
Learners explore how aerosols are used in science to indicate volcanic activity and how biomass burning affects global aerosol activity. Students access data and import into MS Excel using graphical data to make inferences and draw...
Curated OER
Identifying Missing Words
How do you figure out the meaning of a word you don't know? Young readers develop skills to identifying missing words in a story using context clues. Picture clues are used to identify covered words in the story I Can’t Get My Turtle to...
National Wildlife Federation
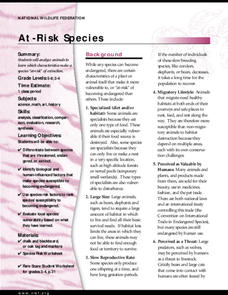
At-Risk Species
Certain behaviors make species vulnerable to extinction and others protect them. By studying species that are currently endangered, learners draw conclusions about these behaviors. They then apply their conclusions to healthy species and...
EduGAINs
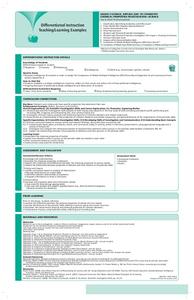
Chemical Properties Investigation
This lesson demonstrates differentiated instruction at its best. Over the course of 2-3 class periods, young chemists have the opportunity to gain a thorough understanding of metals and their chemical properties from a variety of...
American Museum of Natural History
What's the Big Deal About Paleontology?
Paleontologists could be considered detectives of the past. A quick online lesson describes the science of paleontology and the importance of fossils. Young scientists read about how paleontologists analyze the features of fossils to...
NASA
Exploring the Moon
Can plants grow on the moon? The second instructional activity in a five-part series has pupils explore the resources available on the moon to determine if plant life is possible. They use lava rocks as their soil and draw conclusions...
August House
Stone Soup
Sharing and cooperation are difficult skills for kindergartners to grasp. Using the story Stone Soup and a series of activities, kids learn about the benefits of working together, categorizing and comparing items, and eating healthy foods.
Teach Engineering
Hydrogen-Oxygen Reaction Lab
High schoolers conduct an experiment using the reaction of hydrogen and oxygen. After pairs balance the chemical equation for making water, they mix different ratios of hydrogen and oxygen in a chemical reaction. Classmates...
Georgia Department of Education
Math Class
Young analysts use real (provided) data from a class's test scores to practice using statistical tools. Not only do learners calculate measures of center and spread (including mean, median, deviation, and IQ range), but also use this...
Balanced Assessment
Stock Market
Analyze trends in the stock market using histograms. Future economists use data presented in a histogram to find periods of greatest increase and decrease. They also draw conclusions about days that would be best to invest.
Chymist
Landfills and Recycling
Examine the nature of landfills through experimentation. Scholars build miniature landfills and monitor changes over a six-week period. Observations allow individuals to draw conclusions about the different types of trash and their...
Concord Consortium
Gestation and Longevity
Is the gestation length of an animal a predictor of the average life expectancy of that animal? Learners analyze similar data for more than 50 different animals. They choose a data display and draw conclusions from their graphs.
Concord Consortium
Circumscribed Polygon
Trigonometry teachers often go off on a tangent, and here's a worksheet that proves it! First, young mathematicians use a formula with tangent to prove a formula correct for area. Then, they draw conclusions about the area of a circle...
Howard Hughes Medical Institute
Look Who's Coming for Dinner: Selection by Predation
What happens when a new predator comes to town? Learners analyze an experiment that studies the effect of predation on selection. They use real data to draw conclusions about the impact a new predator has on a prey species.
Howard Hughes Medical Institute
Weighing the Evidence for a Mass Extinction: Part 1 – In the Ocean
Extinction events have happen throughout geologic history, but only five mass extinctions occurred over the last 4.5 billion years. Scholars view fossils from a layer of sediment during an extinction event and observe patterns to draw...
Howard Hughes Medical Institute
Battling Vector-Borne Diseases: Factors That Affect the Mosquito Life Cycle
Slow the spread of disease by slowing disease carriers in their tracks. Learners explore just how they might accomplish this as they experiment with the life cycle of a mosquito under different conditions. Scholars design and conduct...
Serendip
The Molecular Biology of Mutations and Muscular Dystrophy
Different types of mutations cause unique types and degrees of muscular dystrophy. Scholars learn about the types of mutations and the impact on the body. They compare the location of the mutations and draw conclusions about how it is...
Las Cumbres Observatory
Plotting an Asteroid Light Curve
Data can tell us a lot about celestial objects that are just too far away to study otherwise. Learners examine data on the brightness of an asteroid to predict its rotation rate. Graphing the data reveals a periodic pattern that allows...
Las Cumbres Observatory
Star In a Box
Stars may all look the same from down here, but their surfaces tell a different story. Using an animation, learners collect data about the temperature and luminosity of stars and compare them to their mass and radius. They then answer...
NASA
Hurricanes as Heat Engines
Hurricanes are a destructive yet fascinating phenomenon. Individuals examine evidence that hurricanes use thermal energy from the ocean as they approach land. Learners use images, charts, and graphs to collect data and then draw...


