Curated OER
The Fabled Maine Winter
Students graph and analyze scientific data. In this research lesson students use the Internet to obtain data then draw conclusions about what they found.
Curated OER
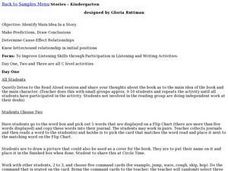
Identify Main Idea in a Story
Help your kindergarteners identify the main idea in a story. Small groups work with the teacher to make predictions and draw conclusions. They are able to determine cause and effect relationships. The lesson is divided into several days,...
Curated OER
Analyzing Two or More Nonfiction Texts
How does recognizing the author's purpose help you draw conclusions about a topic? Using two articles (both are attached), learners brainstorm why each author wrote each article. Are their purposes similar or different? Learners use a...
Curated OER
Using MY NASA DATA to Determine Volcanic Activity
Students explore how aerosols are used in science to indicate volcanic activity and how biomass burning affects global aerosol activity. Students access data and import into MS Excel using graphical data to make inferences and draw...
Curated OER
A Closer look at Oil and Energy Consumption
Upper graders analyze basic concepts about the consumption, importation and exportation of the worlds oil production. They create several graphs to organize the data and draw conclusions about the overall use of oil in the world.
Curated OER
The Good and Bad Bacteria
High schoolers are able to name one kind of harmful bacteria and why it hurts us and also name one kind of helpful bacteria and how we use it. They describe the process of growing bacterial cultures in a lab. Students create a reasonable...
Curated OER
Germs and the Importance of Washing Your Hands
Students observe what happens when bread is handled by dirty hands. They read and discuss the book "Germs." Students participate in an experiment. Students touch bread with a variation of hands: dirty, washed with soap and water, washed...
Curated OER
How Is the Periodic Table Organized?
Fifth graders access an Interent site to review the Periodic Table. They identify patterns and draw conclusions about the organization of the periodic table. They complete a teacher created chart using the Periodic Table.
Curated OER
Cold, Clouds, and Snowflakes
Students explore satellite data and graphing. In this weather data analysis math and science lesson, students analyze NASA satellite data to draw conclusions about geographical areas where precipitation might have happened. Students...
Curated OER
The Solstices
Compare surface temperatures when the solstice occurs in the different hemispheres. Young scientists draw conclusions from their investigation of data collected using spreadsheets and a globe.
Curated OER
Identifying Missing Words
How do you figure out the meaning of a word you don't know? Young readers develop skills to identifying missing words in a story using context clues. Picture clues are used to identify covered words in the story I Can’t Get My Turtle to...
Curated OER
Chocolate Graphing
Chocolate lovers develop a bar graph based on the types of chocolate the class likes. They participate in The Art of Chocolate at The Hershey Story before they make a bar graph that shows the favorite chocolate types of their class. They...
EngageNY
How Do Dilations Map Lines, Rays, and Circles?
Applying a learned technique to a new type of problem is an important skill in mathematics. The lesson asks scholars to apply their understanding to analyze dilations of different figures. They make conjectures and conclusions to...
Curated OER
Identify Cause and Effect
Students listen to a story about school in a one-room schoolhouse. In this cause and effect lesson, students create a Venn diagram to find the similarities and differences in schools then and now. Students discuss how past events help...
Curated OER
The Mystery Box
Students work in groups with a wooden box that is sealed shut. They make predictions about what is inside the box. Before being allowed to open the box, the groups make hypotheses, conduct experiements, record results, draw conclusions,...
Curated OER
People Experts
Students examine pictures of people and draw conclusions about them. Using worksheets, students take a second look and carefully examine the pictures to determine what influenced their perceptions.
Curated OER
Exploring Similarity Using Scale Drawings
Learners explore scale factor as they create a scale drawing of a box, then determine the surface area and volume of the original and the scale drawing. The one page worksheet contains activities and procedures with four questions.
Curated OER
When A Story Met A Sandwich
How is a story like a peanut butter and jelly sandwich? Use making a sandwich as a metaphor to remind your writers that a good, solid beginning, a rich and rewarding middle, and an ending that brings everything together spices up a...
Curated OER
Systems of Equations and Inequalities
This is a comprehensive lesson on creating and solving equations and systems of equations and inequalities. Problems range from basic linear equations to more complex systems of equations and inequalities based on a real-world examples....
The New York Times
The One-Question Interview
Generate interest in current events, the theme of a new unit, or a research project. Individuals select a question from the list generated by the class, conduct one-on-one interviews, analyze the responses, draw conclusions based on...
Space Awareness
Continental Climate and Oceanic Climate
There's nothing better than a cool breeze blowing in from the ocean. Scholars explore how water affects change in temperature using a hands-on experiment on climate. They use measurement tools to compare the continental and oceanic...
Statistics Education Web
How High Can You Jump?
How high can your pupils jump? Learners design an experiment to answer this question. After collecting the data, they create box plots and scatter plots to analyze the data. To finish the lesson plan, they use the data to draw conclusions.
NASA
Determining the Nature, Size, and Age of the Universe
Prompt scholars to discover the expansion of the universe themselves. Using photographs of other galaxies, they measure and then graph the size and distance of each. Finally, they draw conclusions and prove the universe is expanding.
Beyond Benign
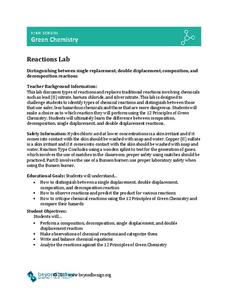
Reactions Lab
You're bound to get a reaction from your classes with this experiment! Scholars perform several chemical reactions, make observations, and classify the reactions as single replacement, double replacement, composition, or decomposition...
Other popular searches
- Drawing Conclusions Reading
- Data. Drawing Conclusions
- Drawing Conclusions Lessons
- Drawing Conclusions in Reading
- Data Drawing Conclusions
- Reading "Drawing Conclusions
- Drawing Conclusions Worksheets
- Drawing Conclusions Science
- Drawing Conclusions From Text
- Drawing Conclusions Activities
- Drawing Conclusions From Data


