Syracuse University
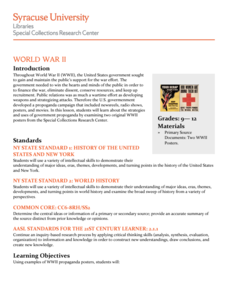
World War II
During World War II propaganda was as important to the war effort as the soldiers in the field. Scholars consider how the government communicated messages of patriotism with propaganda by examining pieces from World War II. Then, they...
Syracuse University
Civil War
What was it like to enlist as a soldier in the Civil War? By using enlistment papers, young scholars consider this question. After they've looked at the primary source and discussed it, they create a short story of a fictional soldier to...
Curated OER
Analyzing Sonnets
Model for your class how to craft an analysis of a sonnet by examining the literary techniques used, the background of the poet, and critical reviews of the poem. As guided practice, learners are assigned a sonnet, complete a preliminary...
Curated OER
Active and Passive Voice: Finding Examples Online
Incorporate technological fluency with a search for examples of active and passive voice in online resources. Discuss how use of active or passive voice influences mood or tone and contributes to author's purpose. List of...
Curated OER
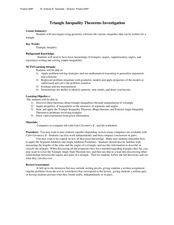
Triangle Inequality Theorems Investigation
Learners estimate and measure triangles. For this geometry lesson, students identify the relationship between three sides and a triangle. They use the inequality theorem to decide if a triangle will be formed or not.
Curated OER
Early Americans - Their Culture and Law
Students examine the laws, food, clothing, and shelter of early American Indian cultures. They conduct research, answer questions, and plan and map out an early American Indian village.
Curated OER
Examine the Data
Seventh graders examine a teacher-created database and identify specific variables and develop hypothesis statements as to their possible effect. They create a summary statement either proving or disproving their hypothesis.
Curated OER
Sweet Data
Students input data about the colors of their serving of M&M candies onto a spreadsheet. They create charts and graphs based on this information.
Curated OER
M&M Probability
Students apply the scientific method in order to determine the probability of specific colors in a bag of M&M's. They determine the definition of probability and how it can be used. They make a hypothesis and conduct an experiment to...
Curated OER
Height versus Shoe Size
Students find a correlation between a person's height and his/her shoe size. They have access to entering data into lists on a graphing calculator and can complete scatter plots. Students read and interpret a scatter plot and use the...
Curated OER
Global Economy: A Simple Activity
Students explore the global economy. In this economics lesson, students examine clothing labels in search of the countries the clothing was made in. Students consider the implications of a global economy.
Curated OER
Comparing Themes Across Texts
Read various texts to compare the themes across each text. Learners write a journal entry describing the most beautiful scenery they've seen and use a map of the United States to locate the Sequoia National Park and Muir Woods. They then...
Curated OER
Cloudy vs. Clear
Students analyze line plots. In this weather lesson using real NASA data, students discuss how weather affects the way the Earth is heated by comparing different line plots.
Curated OER
Raisin the Statistical Roof
Use a box of raisins to help introduce the concept of data analysis. Learners collect, analyze and display their data using a variety of methods. The included worksheet takes them through a step-by-step analysis process and graphing.
Curated OER
Graphing Pendulum Results
Sixth graders set up a pendulum experiment deciding which variable to manipulate (length of string or weight on the string). They create a hypothesis, collect necessary equipment, and write out each step of their experiment. They then...
Curated OER
Seeing Is Believing
Students investigate the concepts of probability. They use data to find the central tendency, median, and mode. Students design and play a game in order to practice the concepts. They also complete a table with data that is analyzed.
Curated OER
How Alike Are We?
Fourth graders find the range, mode, median, and mean for each of the data sets (height and shoe size). They discuss which measure of central tendency for each data set best represents the class and why. Students graph the shoe size and...
Curated OER
Science Fair With An Energy Efficiency Flair
In order to learn more about energy conservation, pupils work to promote energy efficiency by participating in a school-wide science fair with an emphasis on energy conservation. In addition to displaying their projects, learners invite...
Curated OER
Civil War Photographs: What Do You See?
A study of an image from The Library of Congress collection Civil War Photographs 1861-1865 launches an investigation of the connection between the Civil War and American industrialization. After analyzing “Petersburg, Va. The...
Curated OER
Graphs and Data
Students investigate poverty using graphs. In this algebra lesson plan, students collect data on the effects of poverty and use different rules to analyze the data. They graph and use the trapezoid rule to interpret the data.
Curated OER
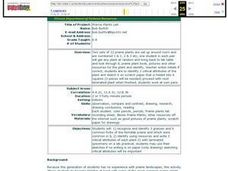
Prairie Plants Lab
Students recognize and identify 3 grasses and 9 common forbs of the fermilab prairie and which were common in IL, identify using resources and write 3 critical attributes of each plant.
Curated OER
First You Take an Ecumene
Although this was written regarding Canadian agriculture, it can be used in any agriculture or environmental science class. Learners evaluate agricultural and economic activity maps and consider land use competition. Activities that get...
Curated OER
Writing the Newspaper Article
The class reads several newspaper articles and analyze them for purpose, style, tone, length and organization. They interview each other about important events in their lives and write journalistic articles.
Curated OER
Can You Get the Signal?
What is a signal word? Recognizing these words is an important step in both reading and writing formal text. Review a list of signal words (provided and organized into specific categories), and then have your class play a game to...
Other popular searches
- Drawing Conclusions Reading
- Data. Drawing Conclusions
- Drawing Conclusions Lessons
- Drawing Conclusions in Reading
- Data Drawing Conclusions
- Reading "Drawing Conclusions
- Drawing Conclusions Worksheets
- Drawing Conclusions Science
- Drawing Conclusions From Text
- Drawing Conclusions Activities
- Drawing Conclusions From Data


