Howard Hughes Medical Institute
Evolution in Action: Data Analysis
An environmental factor, such as a drought, sometimes speeds up the rate of natural selection. Scholars analyze data on the beaks of birds around the time of the drought. They compare those that survived to those that perished and find...
Las Cumbres Observatory
Plotting an Asteroid Light Curve
Data can tell us a lot about celestial objects that are just too far away to study otherwise. Learners examine data on the brightness of an asteroid to predict its rotation rate. Graphing the data reveals a periodic pattern that allows...
Curated OER
The Mystery Box
Students work in groups with a wooden box that is sealed shut. They make predictions about what is inside the box. Before being allowed to open the box, the groups make hypotheses, conduct experiements, record results, draw conclusions,...
Curated OER
Exploring Similarity Using Scale Drawings
Learners explore scale factor as they create a scale drawing of a box, then determine the surface area and volume of the original and the scale drawing. The one page worksheet contains activities and procedures with four questions.
Curated OER
Outdoor Activities: Solve It-Outdoors
Students practice problem solving skills. In this early childhood education lesson, students foster the ability to use creative and critical thinking to turn obstacles into bridges to greater learning as they complete various activities...
Curated OER
Systems of Equations and Inequalities
This is a comprehensive lesson on creating and solving equations and systems of equations and inequalities. Problems range from basic linear equations to more complex systems of equations and inequalities based on a real-world examples....
NASA
Determining the Nature, Size, and Age of the Universe
Prompt scholars to discover the expansion of the universe themselves. Using photographs of other galaxies, they measure and then graph the size and distance of each. Finally, they draw conclusions and prove the universe is expanding.
Statistics Education Web
How High Can You Jump?
How high can your pupils jump? Learners design an experiment to answer this question. After collecting the data, they create box plots and scatter plots to analyze the data. To finish the lesson plan, they use the data to draw conclusions.
Jamestown-Yorktown Foundation
How Do We Know about Colonial Life?
Young history sleuths examine an inventory of the belongings of a Virginia colonist and use deductive reasoning to determine what the document reveals about colonial life. They then use a Venn diagram to compare the inventory with a...
NASA
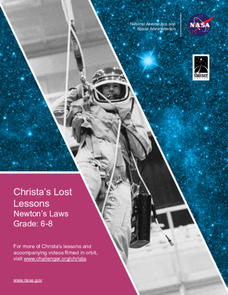
Christa's Lost Lesson: Newton’s Laws
How do the laws of motion work in space? Learners explore Newton's laws of motion in different experiments as part of the Christa's Lost Lessons series. They rotate around the room in three stations to experience each law in action using...
Curated OER
Witch Hunt or Red Menace? Anticommunism in Postwar America, 1945-1954
High schoolers investigate the goals and methods of the House Un-American Activities Committee and offer an opinion regarding whether their investigation of Hollywood was justifiable.
Serendip
Evolution and Adaptations
Survival of the fittest isn't just for the movies! A five-part lesson explores several different species with known adaptations and analyzes them for their survival strategies. Using both video and research data, scholars draw...
Howard Hughes Medical Institute
Understanding Variation
Does where we live influence how our bodies express genetic traits? Explore variation in human skin color with an activity that incorporate video and hands-on learning. Individuals model the relationship between phenotypes and genotypes,...
Serendip
The Molecular Biology of Mutations and Muscular Dystrophy
Different types of mutations cause unique types and degrees of muscular dystrophy. Scholars learn about the types of mutations and the impact on the body. They compare the location of the mutations and draw conclusions about how it is...
California Academy of Science
Discovering Rainforest Locations
How many rainforests are there, where are they, and do global factors effect their locations? These are great questions that have great answers. Children in grades four through eight use several different maps to determine why...
Curated OER
The Newspaper Article
Have your class participate in an interview activity using an informational text about the Amazon. After reading a Cultural Connections story about a person from the Amazon, middle schoolers write interview questions based on the text....
Curated OER
Feeling the Heat
Pupils record temperatures at different locations around campus. They examine the results and draw conclusions about how materials and colors affect the amount of heat produced. They also analyze Los Angeles' temperature records over a...
US Department of Agriculture
Sink or Float?
Will it sink or will it float? Learners predict the outcome as they drop random objects into a container of water. Then, they keep track of the results and record the data in a t-chart to draw a final conclusion.
Kenan Fellows
Determining the Effects of a Golf Course on Stream Health
Do golf courses affect the water organisms in nearby streams and ponds? Small groups collect samples of water upstream and downstream from a golf course and analyze the macroinvertebrates found and the stream index values of the two...
K20 LEARN
Untwining And Intertwining: Chemical Reactions
What happened when the chemistry teacher told a bad joke? There was no reaction! A creative take on the traditional reaction types lesson invites learners to draw their own conclusions about how compounds and elements combine. Groups...
Curated OER
How Credit Card Interest Works
Learners experiment with an Excel spreadsheet model that demonstrates the effects of interest on payments. They calculate actual costs, interest paid, and time necessary to pay off credit purchases and draw conclusions about the...
Curated OER
Gathering Statistics for Research
Young scholars gather statistics to include in their research. In this statistics activity, students investigate how to incorporate statistics into research and other readings besides math. They collect data based on other topics,...
Curated OER
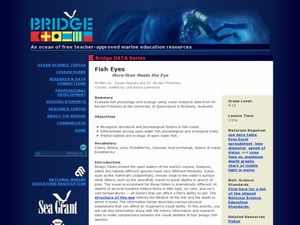
Fish Eyes - More than Meets the Eye
Inform your class about the adaptations in fish eyes: cones, lens size, endothermy, and speed of vision. The adaptations are related to diving behavior. Junior marine scientists compare the adaptations of four different fish species to...
Statistics Education Web
Consuming Cola
Caffeine affects your heart rate — or does it? Learners study experimental design while conducting their own experiment. They collect heart rate data after drinking a caffeinated beverage, create a box plot, and draw conclusions. They...


