Curated OER
Temperature and Water Density
Students consider the effects of temperature on water density. In this Earth Science lesson, students evaluate a demonstration of cold and hot water currents in a model. Students use two liter bottles and varied water temperatures with...
Space Awareness
Oceans as a Heat Reservoir
Oceans absorb half of the carbon dioxide and 80 percent of the greenhouse gases released into the atmosphere. Scholars learn how and why the oceans store heat more effectively than land and how they help mitigate global warming. Pupils...
Colorado State University
How Far Away Is Space?
Outer space may be a lot closer than you think! Science scholars model the layers of the atmosphere using transparencies to gain insight into the scale of space. The resource includes ideas to tailor the activity to the skill level of...
Curated OER
How Hot is that Planet?
In this planet worksheet, students read about finding the temperature of a planet using the distance to its star, its reflectivity and the luminosity of the star. Students use a given equation to determine the surface temperature of the...
Curated OER
It's Just Right
Young scholars conduct an experiment to determine the temperature tolerance of yeasts. In this biology lesson plan, students collect data and compare them by plotting graphs. They explain how extreme temperatures affect organisms.
Curated OER
Variables and Expressions from Around the Cosmos
In this variables and expressions activity, students solve 7 problems using different mathematical formulae to find the length of Earth's day in the future, the distance to the galaxy Andromeda, the temperature of a gas cloud emitting...
Curated OER
The Frozen Desert: Graphing and Comparing Climates
Students explore the concept of climate. They use temperature and precipitation data from their area and other regions to construct climate graphs. These graphs are used to help identify factors that influence climate.
Curated OER
Our Solar System
In this solar system worksheet, students complete a database comparing the 9 different planets' mass, surface temperature, rotation period, orbital period, moons, and distinguishing features. This worksheet is a graphic organizer.
Curated OER
Factors Affecting Ocean Currents
Students design and conduct an experiment to determine the effect of salinity and temperature changes in the movement of ocean currents. For this earth science lesson, students record observations and collect data. They share their...
Curated OER
Hurricane Frequency and Intensity
Students examine hurricanes. In this web-based meteorology lesson, students study the relationship between ocean temperature and hurricane intensity. They differentiate between intensity and frequency of hurricanes.
Curated OER
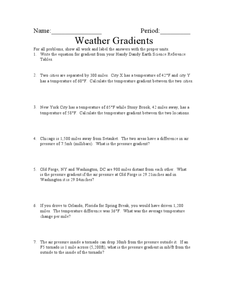
Weather Gradients
In this weather gradients learning exercise, students solve 7 problems which include finding the temperature and pressure gradients between different cities in the United States. They use a table from their book that gives them the...
Curated OER
Glaciers and Global Sea Rise
Students explain how melting glaciers affect global warming. In this earth science instructional activity, students investigate the change in ice density as it melts. They discuss the human and environmental impact of rising sea levels.
Curated OER
In the Eye of the Hurricane
In this science worksheet, students read about temperature and thermal energy in a hurricane. Students also draw their own hurricane and label 5 different parts.
Curated OER
Probing Below the Surface of Mars
Learners simulate the search for water in Mars using simple apparatus. For this space science lesson, students explain how soil temperature affects the cooling of probes. They graph the data collected from the simulation.
Curated OER
Glaciers As Indicators of Global Climate Change
Students research about glacial ice melting on the four major spheres of the Earth. In this earth science lesson, students explain how this process relates to global warming. They create a presentation and share their findings with the...
Curated OER
Causes and Effects of ENSO
Students analyze monthly sea surface temperature data from the Pacific Ocean to determine if the period is an El Nino or a normal year. They recognize signs to see if there are any patterns that signal either occurrence. Satellite images...
Curated OER
Using the Synoptic Code for the Prediction of Water
Students construct a thermoscreen for the experiment. In this earth science instructional activity, students make observations and interpret them using synoptic codes. They predict the weather based on gathered information.
Curated OER
Mulch
Students conduct a series of experiments on mulching. In this earth science instructional activity, students discuss the benefits of mulching on soil. They explore how different types of mulch affect plant growth.
Curated OER
What on Earth is Matter?
A somewhat strangely formatted slide show that contains multiple examples of matter types. The classification and state explanations given would be useful as practice of substance identification and the heating curve may prove to be...
Curated OER
Earth Systems
Ninth graders investigate biological systems. They summarize relationships between systems. Students determine how systems relate within the biosphere. They analyze the carbon cycle.
National Wildlife Federation
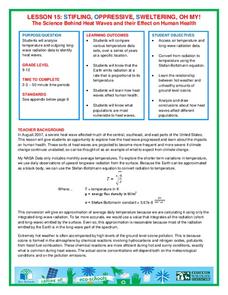
Stifling, Oppressive, Sweltering, Oh My!
Looking for a hot date? Pick any day in August, statistically the hottest month in the United States. The 15th lesson in the series of 21 instructs pupils to investigate the August 2007 heat wave through NASA data, daily temperature...
Curated OER
Terrestrial Ecosystem Response to Climate Change
An extensive investigation of the Earth's climate changes awaits your environmental science classes. This top-notch presentation begins by looking at the history of Earth's climate and then predicts the impact on each major terrestrial...
Curated OER
The Sun, Moon, and Our Solar System: Teacher/Student Notes
Introduce basic Earth and space science to your budding astronauts. This handout works in two ways, the first part provides information about the sun, moon, eclipses, and Earth to be read to or by the class. The second part is composed...
Chicago Botanic Garden
Historical Climate Cycles
What better way to make predictions about future weather and climate patterns than with actual climate data from the past? Young climatologists analyze data from 400,000 to 10,000 years ago to determine if climate has changed over time....


