Curated OER
Human Activity and the Environment
Students review and analyze graphs and tables as a group. They develop their graph and data analysis skills by converting data tables from Human Activity and the Environment into graphs.
Creative Learning Exchange
Lesson Plans From The Lorax
When it comes to the environment, no variable is constant. Class members graph behavior over time for the thneeds produced over truffula trees chopped down over the course of Dr. Seuss's The Lorax.
Virginia Department of Education
Predator-Prey Simulation
Do your pupils have the misconception that environmental predators are "bad" and harm smaller creatures? The simulation explains, in detail, the important role predators play in maintaining a stable ecosystem. Through web-based research,...
National Museum of the American Indian
The A:Shiwi (Zuni) People: A Study in Environment, Adaptation, and Agricultural Practices
Discover the connection of native peoples to their natural world, including cultural and agricultural practices, by studying the Zuni people of the American Southwest. This instructional activity includes examining a poster's...
McAuliffe-Shepard Discovery Center
Global Warming in a Jar
This well-organized lab activity introduces earth science pupils to the greenhouse effect. They will set up two experiments to monitor temperatures in an open jar, a closed jar, and a closed jar containing water. Ideally, you would have...
Curated OER
Water in the Geosphere
Through a PowerPoint presentation and the embedded animation and video, earth science enthusiasts find out about the moisture in the soil beneath our feet. In the animation, follow a water molecule on its path through the water cycle. As...
Curated OER
Recycling-Taking it Easy on the Environment
Students review the garbage/landfill graphs included with the instructional activity. They discuss the information on the graphs and discuss which garbage products come from their homes. Students collect examples of over packaging to...
Curated OER
Our Environment
Students examine the world's environmental dilemmas and create project depicting how to improve the environment. They study ten endangered species.
McGraw Hill
Population Biology
The carrying capacity of an environment varies based on the organisms that live there. Using a virtual lab simulation, scholars test two protists living in their own environments and a third environment where both protists live. They...
Curated OER
When Ants Fly
Here is a great lesson on constructing line graphs. Learners identify common characteristics of birds, ants common needs of all living things. They also write a story from the perspective of an ant or a bird that has lost its home and...
Chicago Botanic Garden
Plant Phenology Data Analysis
Scientists monitor seasonal changes in plants to better understand their responses to climate change, in turn allowing them to make predictions regarding the future. The last activity in the series of six has scholars analyze BudBurst...
Sea World
Whales
A whale of a lesson is sure to intrigue your elementary oceanographers! Learn about the mammals of the sea with a series of activities about whales, dolphins, and porpoises. Kids complete worksheets about the anatomy of a whale, create a...
Howard Hughes Medical Institute
Ocean Acidification
Human impacts on the environment can sometimes be difficult to measure, especially under water! An activity centered on ocean acidification gives science scholars the opportunity to examine the effects of carbon dioxide on marine life....
Curated OER
Trash to Gas
Middle schoolers experiment with biomass materials as alternative energy sources. In this biomass material activity, students participate in an experiment with cow manure to determine how it can be used as an energy source. They record...
Curated OER
The Living Environment
Students use a spoon, clothespin, scissors, and toothpicks to simulate how animals get food in their environment. In this environment lesson plan, students learn about the adaptations animals make in order to survive.
It's About Time
The Sun and Its Effects on Your Community
Why is the sun round? Examine this question, and others, with your pupils while teaching them how to live in a more earth-friendly environment. Pupils explore Sun composition and discuss how solar wind, sunspots, and solar energy affects...
Centers for Disease Control and Prevention
Microbe Multiplication Magic
A lesson introduces the reproduction rate of E. coli though a video. Then scholars complete a data table and graph of reproduction rates in ideal conditions as well as less than ideal conditions.
Howard Hughes Medical Institute
Patterns in the Distribution of Lactase Persistence
We all drink milk as babies, so why can't we all drink it as adults? Examine the trend in lactase production on the world-wide scale as science scholars analyze and interpret data. Groups create pie charts from the data, place them on a...
UAF Geophysical Institute
Carbon Footprint
Your young environmentalists can calculate their carbon footprint and discuss ways to reduce it with a worksheet about climate change. After reading a handout about what impact one's carbon footprint can have on the environment, kids...
Beyond Benign
Orb-It
How do the products you use rate on a greeness scale? Scholars use a tool to analyze shampoos and cars for their sustainability. They consider factors that affect the environment, the economy, and equity. This is the ninth lesson in a...
National Academy of Sciences
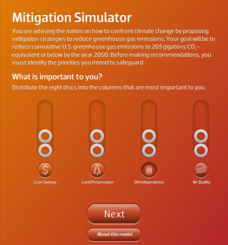
Mitigation Simulator
The United States has more per capita emissions than any other country in the world. An eye-opening simulation encourages users to explore environmental goals and factors that affect climate change by balancing different priorities....
Chemistry Collective
Virtual Lab: Weak Acid and Base Problems
You'll feel strongly about this weak acid and base virtual lab! Scholars experiment with the wonders of dissociation constants in a simulated lab environment. The accompanying written work includes buffer preparation, titration curves,...
Curated OER
Graphing the Standard Curve
Learners analyze colorimetric using a computer program. In this science lesson, students show application of standard curves by finding other areas of science where standard curve is analyzed.
Curated OER
The Frozen Desert: Graphing and Comparing Climates
Students explore the concept of climate. They use temperature and precipitation data from their area and other regions to construct climate graphs. These graphs are used to help identify factors that influence climate.


