Curated OER
It's All in the Air
Young scholars examine air quality. They test the air for visible pollutants by observing jars for one week and compare and contrast the data they collect. After comparing and contrasting the data, they graph the results of pollution...
Curated OER
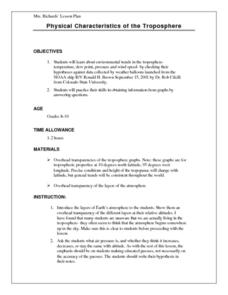
Physical Characteristics of the Troposphere
Students lexplore environmental trends in the troposphere- temperature, dew point, pressure and wind speed- by checking their hypotheses against data collected by weather balloons.
Curated OER
Heavy Breathing
Students investigate asthma and air quality, and then map or graph the incidence of asthma by county and air quality information by county in the state of Maryland. They attempt to see any correlations and note any limitations of the data.
Curated OER
Evaluate Ecosystems
Students collect data from a field study. They write an environmental impact statement and design a plan to improve the ecosystem they have been observing. Finally, they give a presentation on the data and information they have collected.
Curated OER
Amphipods
Students identify organisms that live at the bottom of the body of water. In this biology lesson, students evaluate the effects of pollution to amphipods population. They examine collected data and create a bar graph comparing them.
Curated OER
Physical Characteristics of the Troposphere
Students examine troposphere graphs and mcompare their hypotheses with data collected by weather balloons launched from the NOAA ship, Ronald H. Brown. they write summaries about the physical properties of the troposphere.
Curated OER
Water-Is There Going to be Enough?
High schoolers research the availability, usage and demand for water in the local area historically and use projections of the availability, usage and demand for water up to the year 2050. They gather data and present the information in...
Curated OER
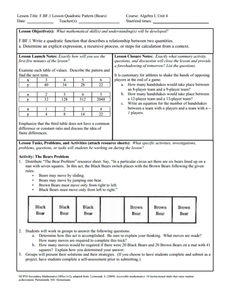
Bears
Young scholars complete a variety of bear-related activities. They sort and graph teddy bears, distinguish between real and non-real bears and research bear life cycles and habitats.
Curated OER
Rainforest Deforestation and the Water Cycle
Students create terrariums (mini rainforests). They observe and discuss the life processes that occur in their terrariums and how changes in these processes affect the plants and organisms inside. They collect and graph data and present...
Curated OER
Kincaid Shelter Stratigraphy
Seventh graders illustrate how archeologists use stratigraphy to help determine environmental changes in a specific area since the Pleistocene Era, and to point out that these changes have affected the animals living in that area.
Curated OER
What Are Our Risks From Radon?
Students discover the risks from radon. They examine a graph of what a low dose of radon will do to a human body and then discuss. They answer questions to complete the lesson.
Curated OER
Weather Conditions During the Spring Monarch Migration
High schoolers keep a detailed record of weather patterns during the spring migration of the monarch butterfly. The use of weather reports is used to form a class data sheet. This lesson connects to the skills of graphing and critical...
Curated OER
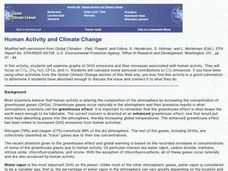
Human Activity and Cllimate Change
Learners perform activities to explore the affect of human activity on climates. They examine graphs of GHG emissions and their increases that are associated with human activity. Using a Global Climate Changing website, students explore...
Curated OER
Show Me The Dinos
Students explore a site of numerous fossil excavations. Using an interactive quarry map, they locate dinosaur specimens and individual bones. In groups, students use "Show Me" cards to answer questions, compile information, and create...
Curated OER
Effects of Ozone in the Air
Fifth graders learn how ground-level ozone is an air pollution problem. Students measure ozone levels and graph the results.
Curated OER
Ozone and Temperature Data Analysis, South Pole Antarctica
Students discuss the layers of the atmosphere, and the history of the ozone hole. They discuss the chemistry of the ozone formation. Students compare seasonal data collected with ozonesondes. They compare Antarctic and Arctic ozone hole...
Curated OER
How To Make Yeast Cells Thrive
Students set up and run the experiments they designed in the lesson, 'Population Growth in Yeasts,' using simple yeast-molasses cultures in test tubes. They demonstrate understanding that several environmental factors can contribute to...
Curated OER
Water Pressure Experiments
Students perform experiments measuring water pressure. They record their observations after poking holes in plastic bottles filled with water with the lids on and then off. They discover the role gravity plays in the water flow.
Curated OER
The Pickle "Dill"emma
High schoolers study a problem in their local farming community regarding a pickle factory, and the class is asked to help determine if the pickle factory is the source of a seed germination problem.
Curated OER
Repopulating Michigan's Waterways
Eleventh graders identify the parts of an ecosystem and how communities change over time. In this ecology lesson students formulate a habitat restoration plan.
Curated OER
Can Acid and Bases Remedy the Body?
Students experiment with acids and bases using technology-based "probe-ware", computers, and household products in this exciting biology/chemistry lesson plan. The lesson plan was written for an advanced 6th grade class.
Curated OER
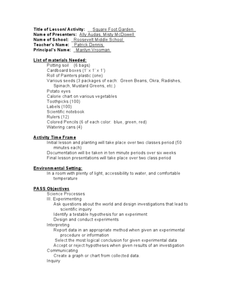
Square Foot Garden
Students plant a garden and keep track of it. In this geometrical garden lesson plan, students collect data from their garden twice a week. They graph their finding and figure out how many square feet of growing space each person needs...
Curated OER
Scientist Tracking Network
Students correlate surface radiation with mean surface temperature of several geographic regions. They observe how these parameters change with latitude and construct an understanding of the relationship of solar radiation to seasonal...
Curated OER
Using Vegetation, Precipitation, and Surface Temperature to Study Climate Zones
Middle schoolers begin their examination of the climate zones found around the world. Using a software program, they identify the relationship between the vegetation, climate and temperatures of the different zones. They also plot...


