CK-12 Foundation
Method of Cylindrical Shells
Approximate the volume of a solid of revolution. Using a method similar to approximating the area under a curve, pupils investigate the volume of a solid of revolution. The learners use a given definite integral to find the volume of...
National Security Agency
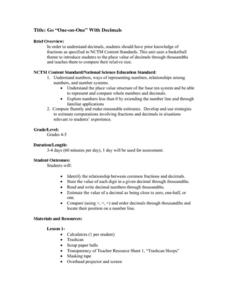
Go One-on-One with Decimals
Shoot and score with three basketball-themed lessons about decimals. Young mathematicians compare game statistics, make trash can hoops, and play a data spinner game to practice identifying digits and values within decimal numbers.
Curated OER
Egg Fun
Students explore the physical properties of eggs. In this scientific observation lesson, students define characteristics of eggs, measure eggs vertically and horizontally, and use the scientific method to perform simple experiments using...
Curated OER
Tiling Tessellations
Students explore tessellations. In this shapes and geometry lesson, students describe the attributes of many of the shapes displayed on an Elmo. Students create examples of tessellations using pattern blocks.
Curated OER
Wild and Wetlands
Upper graders identify the major characteristics of a wetland. They explore the human factors that change a wetland and write a descriptive paragraph about wetlands. This comprehensive lesson also has an interactive "Watershed Game"...
Curated OER
Is Bigger Always Better?
Explore rational numbers with the young mathematicians in your class. They will investigate decimals, fractions, and percents before ordering and comparing rational numbers. This multi-day unit includes differentiation activities and...
Curated OER
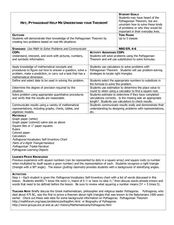
Hey, Pythagoras! Help Me Understand Your Theorem!
Learners explore the Pythagorean Theorem. In this math lesson, pupils solve problems using the Pythagorean Theorem. They select the appropriate numbers to substitute in the formula to solve problems.
Berkshire Museum
Where’s the Water?: Acting Out Science Cycles
Young scientists transform themselves into rivers, oceans, clouds, and drops of water in order to explore the water cycle. After assigning and explaining to students their different roles in the activity, the teacher reads aloud a...
Curated OER
Sliding Along
Third graders explore the concept of linear measurements and how they work. Coins are used to reinforce the process.
Curated OER
Sorting and Analyzing
Young scholars explore sorting and graphing. In this math lesson, students create and analyze a class bar graph about their birthday months. They then estimate and sort candies to make and analyze their own bar graph.
Curated OER
Pan Balance: Shapes
Learners explore the concept of equivalence as it relates to comparing concrete objects to determine greater or lesser attributes such as length and weight. In this pan balance-shapes lesson, students make estimations while verifying...
EngageNY
Tides, Sound Waves, and Stock Markets
Help pupils see the world through the eyes of a mathematician. As they examine tide patterns, sound waves, and stock market patterns using trigonometric functions, learners create scatter plots and write best-fit functions.
Oklahoma State University
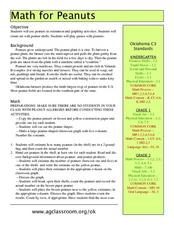
Math for Peanuts
Peanuts! Get your peanuts! Kids explore math, art, and agriculture concepts focused on peanuts. There is a brief informational text to get them started, and you'll find definitions of five in-text vocabulary words to address. Kids...
Curated OER
When Close Enough is Good Enough
Students describe the difference between an estimate and a guess. They create reasonable estimates based on observation and hands-on activities. They synthesize estimated based on interaction with online activities.
Curated OER
Menu Mania
Students explore the concept of estimating by watching a video, and discussing the strategies for estimation. They estimate the costs for various menu items, then calculate the exact amount spent.
Curated OER
"Eggs-ploring" Math with Jellybeans
Learners work in pairs with a small bag of jellybeans to estimate the number of candies in their bags and then figure out how many groups of 10 jellybeans are contained in their bags. They then graph the information using a pictograph or...
Alabama Learning Exchange
Comparing Fuel Economy
Compute fuel economy and gas mileage. Why? So you can teach rates and ratios, of course! Middle schoolers calculate the rate of miles per gallon for various vehicles. They research each vehicle, its mileage per gallon, and cost per...
Shodor Education Foundation
Buffon's Needle
Find the needle on a lined paper. Pupils run a simulation of dropping a needle on a lined paper. The probability of the needle crossing at least one line is pi/2. After each trial, the interactive displays the approximation of pi based...
Perkins School for the Blind
The Price is Right
Go on a shopping trip to practice estimation, price value, and shopping skills. The class heads off to the market to purchase several items for the activity. While they are there, they discuss the cost of various foods and even...
Curated OER
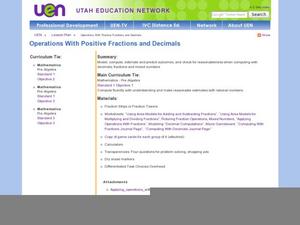
Operations with Positive Fractions and Decimals
Explore the concept of fractions and decimals! In this fractions and decimals lesson, pupils use fraction tiles to express fractions. They play a fraction review basketball game where when a team gets a question correct they get to shoot...
University of Georgia
Stoichiometry of S'mores
How fun would it be to teach the concept of stoichiometry while allowing your chemistry class to assemble a classic campfire treat? This fun and engaging activity allows pupils to explore the principles of the chemical theory while...
Noyce Foundation
Ducklings
The class gets their mean and median all in a row with an assessment task that uses a population of ducklings to work with data displays and measures of central tendency. Pupils create a frequency chart and calculate the mean and median....
Inside Mathematics
Archery
Put the better archer in a box. The performance task has pupils compare the performance of two archers using box-and-whisker plots. The resource includes sample responses that are useful in comparing individuals' work to others.
Noyce Foundation
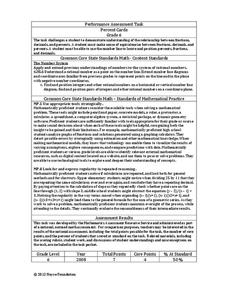
Percent Cards
Explore different representations of numbers. Scholars convert between fractions, decimals, and percents, and then use these conversions to plot the values on a horizontal number line.


