Curated OER
Mechanical Energy
Students discover the difference between kinetic and potential energy in an experiment using toy cars and tracks. In small groups, they set up the experiment to determine the distance milk cartons will travel when hit by toy car. They...
Curated OER
Stellarium
Students explore the rotation of the planets from various locations on Earth
Using planetarium software, they will make observations, and explain how the rotation of the planets varies based on ones location on the Earth. Students...
Curated OER
Wet Weather, Wet Climate
Students discover the differences between weather and climate in this long-term lesson plan introduction. They create rain gauges and practice reading rainfall measurements, view a website showing the cloud cover in their location and...
Curated OER
Top Secret Revealed
Students analyze the relevance of newly-uncovered, revealing C.I.A. document from the 1950's to people today. They explore the details and impact of a secret history of the C.I.A. in Iran by reading and discussing "How a Plot Convulsed...
Curated OER
An Investigative Task
Students read an article about statistics. In this statistics lesson, students are given a detailed overview about statistics and what it entails. This lesson is more informational and hands on.
Science Struck
Science Struck: Guide on Interpolation vs. Extrapolation
Explains what interpolation and extrapolation are and methods used for them in statistics. Gives real-world examples of their applications in telecommunications, engineering, thermodynamics etc.
CK-12 Foundation
Ck 12: Algebra: Linear Interpolation and Extrapolation
[Free Registration/Login may be required to access all resource tools.] Use linear interpolation, linear extrapolation, and the line of best fit to make predictions about a data set.
CK-12 Foundation
Ck 12: Algebra: Linear Interpolation and Extrapolation
[Free Registration/Login may be required to access all resource tools.] Learn how to use linear interpolation and extrapolation to make predictions.
TeachEngineering
Teach Engineering: How High Can a Super Ball Bounce?
Students determine the coefficient of restitution (or the elasticity) for super balls. Working in pairs, they drop balls from a meter height and determine how high they bounce. They measure, record and repeat the process to gather data...
Math Is Fun
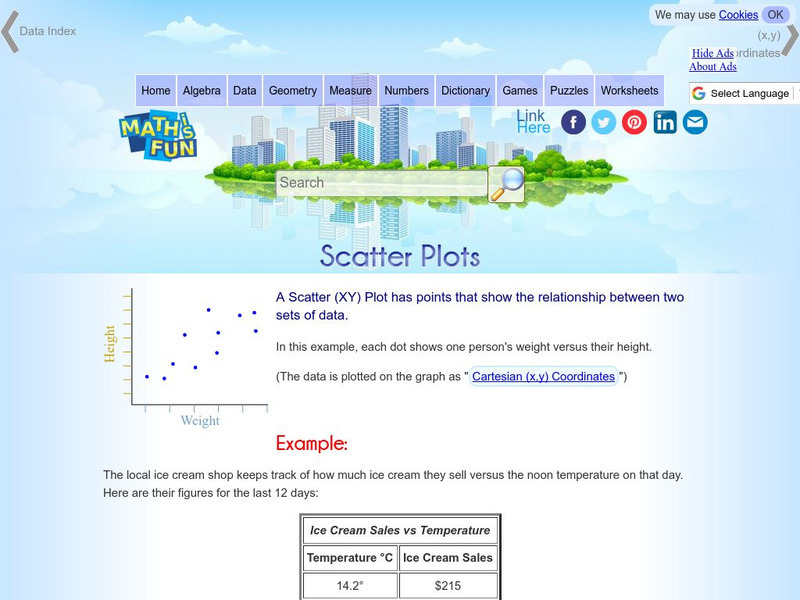
Math Is Fun: Scatter Plots
Explains, with examples, what scatter plots are and how to interpret the data. Discusses trends, interpolation and extrapolation, and correlation. Includes a set of practice questions.
Texas Instruments
Texas Instruments: Math Today for Ti: Is Leisure Time Really Shrinking
Students will to organize data from the USA TODAY Snapshot, "Is leisure time really shrinking?," into two scatter plots and determine the quadratic model for each scatter plot. Students will determine if these graphs intersect and learn...
Other
Introduction to Simple Linear Regression
This introduction to simple linear regression includes graphs and a discussion of extrapolation and interpolation.
ClassFlow
Class Flow: Letter Sequences Algebra
[Free Registration/Login Required] In this flipchart, students learn to identify patterns in a sequence of shapes used to create letters. Students then use logic to extend the pattern and extrapolate further shapes.
Georgia Department of Education
Ga Virtual Learning: Media Literacy
Activities in this comprehensive interactive tutorial will involve determining the strengths and limitations of epidemiological reports. You will also evaluate media messages and develop your own.
Other
Propaganda Critic
A comprehensive site that offers student information on: Name Calling, Glittering Generalities, False Connections, Bad Logic or Propaganda, Wartime Propaganda and more! Site also offers the Propaganda Gallery - short video clips that can...
Texas Instruments
Texas Instruments: Something's Fishy
In this activity, students examine the size, mass, and growth rates for three species of fish. They interpolate and extrapolate from best-fit models. Students compare the growth rates of endothermic and exothermic animals.
Texas Instruments
Texas Instruments: Getting Started With Ti Navigator: Exploring Linear Model
This lesson introduces students' to Activity Center. In this activity, students will explore data on Women's Olympic 400 Meter Freestyle Swimming records. Concepts of domain and range will be investigated in the context of this problem...
Texas Instruments
Texas Instruments: Bacterial Growth and Regression
This activity gives students a set of data to perform a regression analysis. Students need to be able to read the data, perform a regression, and interpolate and extrapolate information.
Science Education Resource Center at Carleton College
Serc: Boiling Water Below Its Boiling Point
Mars has such low atmospheric pressure that any water at the surface would boil away. In this activity, students see that they can get water to boil below its "typical" boiling temperature when they drop the pressure in a closed...
Practical Money Skills
Practical Money Skills: Gross Domestic Product
Learn about the Gross Domestic Product(GDP),the sum total of the market price of all the final goods and services produced within a country's borders during a given period of time.In the U. S. it's measured in quarters of a year, then...
PBS
Pbs: The Lowdown: What You Need to Know About Immigration Reform
Interpret graphs showing changes over time in the percentage of foreign-born US residents and in annual deportations in this interactive from KQED. In the accompanying classroom activity, students use the interactive and look at how...
Other
Stat Soft: Statistics Glossary
Dozens of statistical terms are defined and illustrated in this glossary.
CK-12 Foundation
Ck 12: Analysis: Exponential Models
[Free Registration/Login may be required to access all resource tools.] In this lesson students will be identifying, applying, and solving exponential models manually and with technology. Students examine guided notes, review guided...
Texas Instruments
Texas Instruments: Boat Registration and Manatee Deaths in Florida
Students will explore the data on boat registrations and manatee deaths in Florida. They will use the data, the graph of the data and the line of best fit to make predictions about the relationship of the data.


