Curated OER
Midnight Dumpers
Students explain how pollution affects ground water. They participate in a simulation to discover the location of an illegal dump. Students explore the monetary benefits, risk and environmental concerns are factors in business decisions.
Curated OER
Ann Arbor Growth & Immigration
Third graders describe some of the factors that brought early settlers to Ann Arbor. They read Narrative-A Trip from Utica, New York, to Ingham County, Michigan in 1838. As an added challenge, 3rd graders can use maps to track Silas...
Curated OER
Does Humidity Affect Cloud Formation?
Students use S'COOL data to identify factors that affect cloud formation. They find a data set using the S'COOL database , and use Excel to manipulate the data. Student isolate relevant data, create meaningful graphs from a spreadsheet,...
Curated OER
Bird Ecology Unit
Tenth graders conduct various activities utilizing the scientific method to formulate a hypothesis, conduct a controlled experiment, collect and analyze the data and communicate their results through a poster. They also identify...
Curated OER
Plants and Animals
Seventh graders discover the interconnectedness of plants and animals in ecosystems. In groups, they create a food web and discuss the problems when one link of the chain is broken. To end the lesson, they set up a balanced environment...
Curated OER
Population Growth in Yeasts
Students design an investigation using yeast. In this environmental engineering lesson, students design an investigation to determine how environmental factors affect the growth of yeast. They will collect quantitative data and discuss...
Teach Engineering
Strength of Materials
Pupils examine a stress-strain diagram that compares the advantages and disadvantages of the two common bridge building materials, concrete and steel. The also consider the factors that influence the materials builders choose for their...
Curated OER
Dilations with Matrices
Examine dilation with matrices with your class. Learners write a conjecture for how the scale factor determines the size of an image. They then use their conjecture to write a matrix multiplication problem for the illustrated triangle...
Curated OER
Building Bridges for Young Learners -- Community
Learners compare and contrast communities.They explore factors that influence how people live, the roles of adults and children, and the interaction of people who live and work within a community. The lesson focuses on the country of...
Curated OER
Hurricane Research
Learners examine the factors that influence hurricanes to develop. In this hurricane lesson plan students research atmospheric trends that affect hurricanes and create a summary.
Curated OER
Ocean Impacts of an El Nino Event
Students study sea surface height and temperature and other characteristics of an El Nino. In this ocean impacts lesson students examine the factors that influence an El Nino or La Nina.
Curated OER
Cooking With Solar
Identify how solar energy generates thermal energy by constructing solar cookers with your students. They will evaluate the factors that affect efficiency and the lesson plan can be adapted to capture data in a variety of ways.
Curated OER
Focus on Economic Data: US Employment and the Unemployment Rate, March, 2012
Read all about the various types of unemployment and the United States is are currently at the low-point of an unemployment cycle. Kids examine what economic factors affect the unemployment rate, and what data shows for different US...
Curated OER
Checking the Boxes
Checking boxes on any admissions application is par for the corse. How much does race selections factor into admissions decisions? Kids read a New York Times article on the topic and then answer seven who, what, when, where, and why...
Curated OER
Cuisenaire Multiplication
Cuisenaire Rods give learners an excellent strategy as they learn about multiplication. How many ways can they make the same product? Using a target product, learners lay out rods to achieve that number through various factors. This...
Alabama Department of Archives and History
A Worse Death: War or Flu?
In a instructional activity that integrates history and mathematics, class members create graphs that compare military death statistics from World War I with those that resulted from the influenza pandemic of 1918.
Forest Foundation
Fire Investigation and Experimentation
Assess the probability of a wildfire with several lessons about fire danger ratings and risk factors. After experimenting with fuel moisture, learners explore the various elements that could contribute to a wildfire, such as wind speed,...
Illustrative Mathematics
Traffic Jam
How many cars would be involved in a traffic jam 12 miles long? A slightly ambiguous writing prompt gives learners the opportunity to practice making reasonable assumptions to tackle a real-life problem. Few details are given, so they...
California Academy of Science
California's Climate
The United States is a large country with many different climates. Graph and analyze temperature and rainfall data for Sacramento and Washington DC as you teach your class about the characteristics of Mediterranean climates. Discuss the...
Curated OER
A Multi-Media Approach to Teaching The Grapes of Wrath
Integrate history, math, and art into a study of The Grapes of Wrath with a series of activities that ask learners to investigate the social, political, economic, and environmental factors at play during the 1930s. Designed to be used...
Curated OER
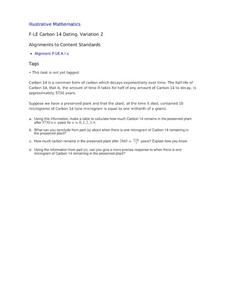
Carbon 14 Dating, Variation 2
Your archaeologists begin this task with a table of values to estimate the time passed based on the half-life of Carbon 14 remaining in a plant. They then move on to find when a specific amount of Carbon 14 is present in the same plant,...
Port Jefferson School District
Water and Climate
Dive into a lesson on the hydrosphere with this Powerpoint presentation. Building on prior knowledge of the water cycle, young scientists learn what happens to water after it falls as precipitation and explore the different factors...
Curated OER
Exponential Functions
Your algebra learners analyze and interpret the general form and the graph of two functions. The increase of the function due to the multiplicative factor is emphasized.
Mt. San Antonio Collage
Quiz 2: Polynomials
Four questions that get right to the polynomial point. High schoolers list all the attributes of a polynomial function, including finding all complex zeros. The last two questions prompt them to write a function based on the given zeros...
Other popular searches
- Common Factors
- Factors of Production
- Biotic
- Factors and Multiples
- Abiotic and Biotic Factors
- Abiotic
- Factors That Affect Climate
- Abiotic Factors
- Limiting Factors
- Biotic Factors
- Greatest Common Factors
- Conversion Factors


