Curated OER
Bits and Pieces: Fractions Greater Than One
Students compare fractions. In this fraction worksheet, students examine the number line. Using the Internet, they explore models of numbers greater than one. Students complete multiple-choice worksheets.
Curated OER
Finding the Percent of a Number
In this mathematics worksheet, 6th graders find the percents of various numbers. They set up the problem, estimate, and write their response. Students also compare their answers to their estimates for each problem.
Curated OER
Calculate Percentages
Sixth and seventh graders study the concept of finding the percent of a number. They calculate the percent of any given number. Pupils describe ways to use calculating percents in their daily life, and change percents into decimals,...
Curated OER
Investigation- What Does It Cost?
Eighth graders investigate percents by comparing different discounts on the same sale item, practice graphing percents, and look at reasonable and unreasonable "percents off" a sale item.
Curated OER
Unit 0 Review - Measurement Lab Equipment
Review questions like these can be used in your biology, chemistry, physics, or earth science classes! They assess scientists' understanding of laboratory measurement tools including graduated cylinders, thermometers, and balances. They...
Curated OER
Empirical Rule Practice Problems
Using the empirical rule for a normal distribution, young statisticians determine the percent of adult women with given heights and weights. They find the percentile rank of a woman of a stated height and find the area under a curve.
Curated OER
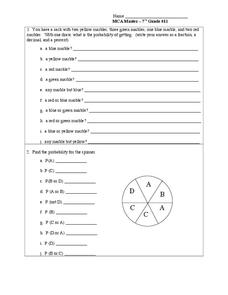
Probability
Seventh graders solve and complete 2 different problems that include a number of other possibilities. First, they draw a marble as stated for each out of a sack of marbles and determine the probability of getting that particular marble....
Curated OER
Are Our Chemical Measurements Accurate or Precise?
What is the difference between accuracy and precision? This instructional activity has students define the terms accuracy and precision, and compare bulleye diagrams to find examples of both. Students analyze given data and determine the...
EngageNY
Solving Area Problems Using Scale Drawings
Calculate the areas of scale drawings until a more efficient method emerges. Pupils find the relationship between the scale factor of a scale drawing and the scale of the areas. They determine the scale of the areas is the square of the...
Flipped Math
Exponential Growth
They grow by leaps and bounds. Learners watch a quick review on function notation as they prepare to learn more about exponential growth. Using their knowledge from sequences, pupils find out whether a function is linear or exponential,...
EngageNY
Percent Rate of Change
If mathematicians know the secret to compound interest, why aren't more of them rich? Young mathematicians explore compound interest with exponential functions in the twenty-seventh installment of a 35-part module. They calculate future...
Illustrative Mathematics
Gotham City Taxis
Taxi! Have your travelers figure out how far they can go in a taxi for $10.00. They must account for the mileage rate and tip in their calculation. They can set up a table or make an equation to solve for the exact mileage they can...
CK-12 Foundation
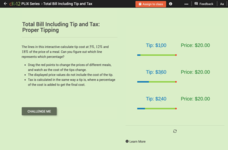
Prices Involving Sales Tax: Proper Tipping
A five-question interactive challenges mathematicians to find a correct tip and total amount using percents five, 12, and 18. A tool with moveable pieces assists participants in locating answers. Types of questions include...
Inside Mathematics
Winning Spinners
Winning a spin game is random chance, right? Pupils create a table to determine the sample space of spinning two spinners. Individuals determine the probability of winning a game and then modify the spinners to increase the probability...
National Research Center for Career and Technical Education
Hospitality and Tourism 2: Costing
The lesson plan provides a richly detailed narrative and sample problems for teaching or reinforcing how to work with percentages. In particular, your audience will compute the costs per serving of food and simulate setting menu prices...
Curated OER
What's in a Number? Analyzing Smoking Statistics
Sixth and seventh graders analyze smoking statistics. In this health lesson, learners look at the percentage of people who smoke from each race group. They create a bar graph and circle graph that displays this information.
CK-12 Foundation
Applications of Linear Systems: Alcohol Solution in Nursing
Solve alcohol systems to find the right solution. The interactive allows pupils to manipulate the amount of a solution and displays the total amount in a mixture. Individuals determine the amount of each solution needed to make 15 liters...
Bowland
Security Camera
Take an overall view of percentages. Pupils determine whether a shop owner's claim is correct about what percent of his shop is viewable from the installed security camera. Learners try to find whether there is a better location for the...
CK-12 Foundation
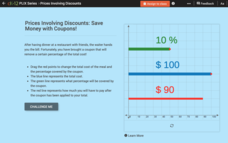
Prices Involving Discounts: Save Money with Coupons!
Nine questions make up an interactive that challenges scholars to identify new prices after discounts. Question types include fill in the blank and multiple choice. A fully-functional tool assists participants in solving word problems....
CK-12 Foundation
Complement Rule for Probability: Changes in an Election
Pupils determine the probability of one mayoral candidate winning given the other's chance. The interactive provides a circle graph to help visualize each candidate's percentages of winning.
Beyond Benign
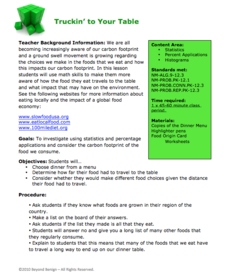
Truckin’ to Your Table
Food takes a trip to the table. Class members choose a meal from a menu and calculate the total cost of the meal including tax and tip. Using a food origin card, pupils determine how far each of the ingredients of a meal traveled to end...
Math Mammoth
Percent Fact Sheet
In this math learning exercise, students are given 9 percentage problems that involve conversion, variables, story problems and fractions.
Math Mammoth
Mental Math in Percent Problems
In this math worksheet, students are given 21 percentage problems which they are to work out mentally. There are story problems, tables and simple conversion.
Curated OER
Percent of Decrease of a Number
In this percent of decrease of a number worksheet, students solve 4 problems using work space provided. Answers are included on page 2.


