Curated OER
Getting to Know You
Students create survey questions for their classmates. In this survey instructional activity, students pick a yes or no question and find what fraction of the class responded yes. They discover how the wording of a survey question can...
Curated OER
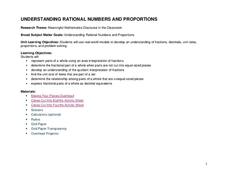
Understanding Rational Numbers and Proportions
Students explore parts of a whole. In this fraction lesson, students determine what makes a fair share. Working with manipulatives, students solve mathematical problems containing fractions.
Curated OER
Tangram Fractions
Students explore tangram puzzles. In this tangram fraction lesson plan, students read Grandfather Tang and then practice solving tangram puzzles. Students identify fractions of the pieces of the tangram puzzles and then create a design...
Curated OER
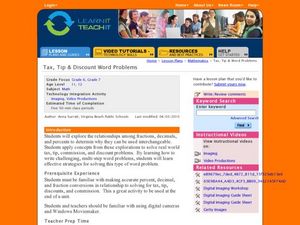
Tax, Tip and Discount Word Problems
Young scholars solve problems involving tax, tips and discounts. In this algebra lesson, students convert between percents and decimals. They calculate commission using conversion from percents and fractions.
Curated OER
Fickled Fractions
Students explore which fractions are made real in our world. They also show the relationship of cross multiplication and equivalent fractions To reinforce fraction skills.
Curated OER
Crafty Fractions
Fourth graders study fractions. In this fractions lesson, 4th graders define fraction-related vocabulary words. Students use beads to study fractions. Students draw shapes to study fraction equivalency and brainstorm fractions they use...
Curated OER
Punch Mix-up
Fifth graders discuss the relationship between equivalent fractions, ratios, and proportions. In this fraction lesson, 5th graders answer questions about a punch mixture in order to find the ratio of ingredients.
Curated OER
Oxymorons
For this vocabulary worksheet, students read 100 English oxymorons. They include "absolutely unsure" and "hone hundred and ten percent."
Curated OER
7th Grade Math Circle Graphs
Seventh graders are able to develop (synthesis) pie graphs with the class and on their own. They are told that pie charts are a graphic representation of material that can be given in the form of parts of a whole by using...
Curated OER
Percentages in Word Problems
Eighth graders, after brainstorming all the places they see percentages in every day life (sales, basketball, grades, etc.), calculate percentages from bases and parts in word problems. They review their notes together on percentage...
Curated OER
Pies and Percentages--Learning About Pie Graphs
In this pie graph worksheet, students draw a pie graph for the zookeeper with the data he collected, choose a different color for each animal species and make a key to the graph.
Curated OER
Decimals, Fractions and Percentages
In this arithmetic instructional activity, 6th graders solve and complete 40 problems. First, they find the value of a number in each decimal listed. Then, students write each list of numbers in order from least to greatest. They also...
Curated OER
Thinking About Technology: What Is It? How Can It Help Us?
What is technology and how can it help us? Using a worksheet, students read a list and choose practical applications of scientific knowledge, brainstorm examples of home, school and hospital technology, graph answers in a pie chart, and...
Curated OER
Fractions and Percentages
In this fractions and percentages worksheet, students are given 4 mental test each with 8 problems including finding percentages, converting decimals and fractions to percentages, and adding, subtracting and multiplying fractions.
Math Drills
Trick-Or-Treat Candy Probabilities
Class members satisfy their sweet tooth with a Halloween-themed, candy probability learning exercise. Using images of candy pieces that represent data, young mathematicians find the probability of getting different pieces of candy while...
Curated OER
Math 121 - Mixture Problems
In this mixture problem worksheet, students read story problems, identify necessary information, and solve mixture problems using the mixture formula. This one-page worksheet contains ten problems. Answers are provided at the bottom of...
Curated OER
Probability: How Likely Am I to...?
Twelfth graders examine various ways probability is applied to daily situations. They use marbles and blocks to calculate the probabilities of picking certain colors. They also calculate the odds of picking a winning raffle ticket.
Curated OER
Skittles Lab
Students use Skittles as manipulatives to practice computing decimals from fractions, computing decimals into percentages, and creating bar graphs from gathered data.
Curated OER
Money and Percentage
Fifth graders examine use of percentages in real world situations. They complete worksheet about using percentages after reviewing the concept. They look through newspapers to find examples of percentages used over the course of three...
Curated OER
Batting the Unknown
Students use batting averages to provide a measure of a player's past success. They use Algebra to calculate required performance to improve the average. Students compare baseball batting statistics early in the season and late in the...
Curated OER
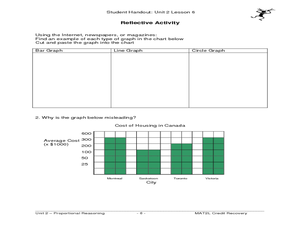
The Circle Graph
In this circle graph activity, students complete problems involving many circle graphs including a compass rose, degrees, and more. Students complete 7 activities.
Curated OER
Find That Bargain!
Students explore the methods of calculating percentages, reading and the construction of graphs, and an awareness of consumer concerns in this activity. The movement of the decimal point often results in uncertainty and confusion. This...
Curated OER
Solving Problems with Proportions
Seventh graders explore the concept of proportions. In this proportion lesson, 7th graders play a review game involving whiteboards. Students work in groups to solve a given proportion the fastest. Students also work in pairs to solve...


