Curated OER
Measures of Circular Motion
Physicists become Olympians in a competition using centripetal force. They ride a bicycle to comprehend relationships between linear and rotational motion. If you have an old-fashioned record player, it can be used to help pupils...
Curated OER
Representing Data 2: Using Box Plots
What information can be gleaned from a box and whiskers plot? Discuss the five summary values - minimum, maximum, upper and lower quartiles, and median - and what conclusions can be made from these values? Included here is a matching...
Curated OER
The Writer’s Toolbox: What You Need to Master the Craft
All the tools (and directions) you’ll need to build an essay are included in a resource designed for learners and educators. The packet can be given to class members or divided into sections and used as part of a series of lesson...
Houghton Mifflin Harcourt
Home Sweet Home: English Language Development Lessons (Theme 5)
Through grand discussion, picture cards, and poems, enhance language proficiency with a Home Sweet Home themed unit created to support English language development. Each lesson follows a listen, speak, move, and/or look routine that...
Curated OER
Transmission of Electricity
Students examine why electricity is distributed at high voltage and the functions of transformers. In this electromagnetism lesson students study at what frequency electricity is distributed.
Curated OER
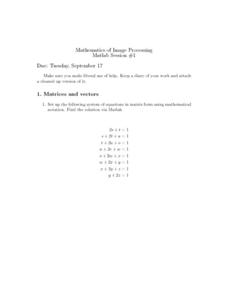
Matrices and Vectors
In this matrices and vectors worksheet, students solve 9 various types of problems related to forming matrices and vectors. First, they set up each system of equations listed in matrix form using mathematical notation. Then, students...
Curated OER
Super Bowl Champs
In this Super Bowl worksheet, students create line plots of all winners and losers of the Super Bowl. They create stem-and-leaf plots, scatter plots, and bar graphs of football data. This one-page worksheet contains...
Curated OER
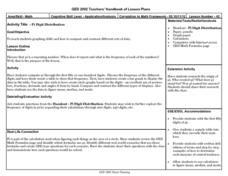
Pi Digit Distribution
Students study graphing skills and compare and contrast data sets. They compute pi through the first 50-100 digits and create a bar graph showing the frequencies of specific digits.
College Board
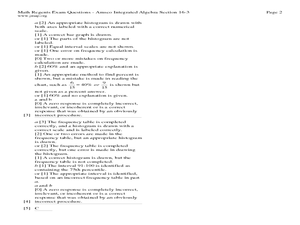
2010 AP® Statistics Free-Response Questions
Familiarity with the AP® exam is highly beneficial for test-takers. Scholars use the 2010 AP® Statistics free-response questions familiarize themselves with the test content and format. Studies and experiments, linear regression,...
Curated OER
Genetic Variability
Using black and white construction paper, evolutionary biologists simulate the classic peppered moth study. They use beans in a frequency and natural selection exercise. Finally, they analyze germinated seeds for variations. All three...
Mathematics Vision Project
Module 9: Modeling Data
How many different ways can you model data? Scholars learn several in the final module in a series of nine. Learners model data with dot plots, box plots, histograms, and scatter plots. They also analyze the data based on the data...
Statistics Education Web
I Always Feel Like Somebody's Watching Me
Future statisticians and potential psychics first conduct an experiment to collect data on whether a person can tell if someone is staring at them. Statistical methods, such as hypothesis testing, chi-square tests, binomial tests, and...
EngageNY
End-of-Module Assessment Task - Algebra 1 (Module 2)
Check for understanding at the end of your descriptive statistics unit with an end-of-module assessment. It uses five questions to measure progress toward mastery of descriptive statistics standards. Each question is developed...
K12 Reader
1st Grade Spelling Lists
If you're looking for spelling lists, check out this resource! Included here are 36 spelling worksheets, each with eight words to study. The worksheets include sight words, and each list also focuses on a particular word...
Houghton Mifflin Harcourt
Let’s Count!: Extra Support Lessons (Theme 5)
In a themed series of lessons and activities, beginner readers are given extra support in reading through chants, games, and practice worksheets.
Houghton Mifflin Harcourt
Surprise!: English Language Development Lessons (Theme 2)
Surprise! is the theme of this series of ESL lessons. Cover an array of topics such as where we live, different times of day, shapes, the city and the country, what we do for fun, jobs, and games, all while practicing how...
Houghton Mifflin Harcourt
Around Town: Neighborhood and Community: Extra Support Lessons (Theme 3)
Neighborhood and community is the theme of a unit comprised of extra support lessons. Following practice pages and a teach, blend, guided practice, practice/apply routine, the series of lessons provide additional reinforcement...
Virginia Department of Education
Numbers in a Name
What's in a name? Pupils create a data set from the number of letters in the names of classmates. Each group then takes the data and creates a visual representation, such as a histogram, circle graph, stem-and-leaf plot, etc.
Curated OER
The Histogram
In this Algebra I/Algebra II worksheet, students construct and analyze histograms to develop a visual impression of the distributions of data. The two page worksheet contains five problems. Answer key is provided.
Curated OER
Analyze and Interpret Statistical Information
In this probability and statistics worksheet, 9th graders analyze and interpret histograms as they identify trends in the data. The two page worksheet contains four problems. Answers are provided.
Curated OER
Peter Rabbit Meets Charles Darwin
Students start to think of evolution in terms of populations. The class follows a cartoon scenario of a rabbit population in which there is selection and change of gene frequency. They receive copies of the scenario or the whole thing...
Curated OER
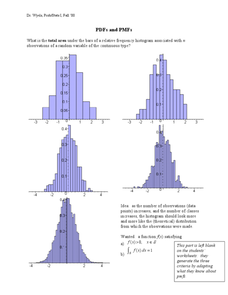
PDF's and PMF's
In this probability worksheet, learners solve for the area under the frequency histograms. They identify the area using the derivative. There are 3 questions.
National First Ladies' Library
There's Only How Much? Rationing in World War II
Students discuss the idea of rationing as a restriction on the amount of something or the frequency with which something may be purchased or used in order to contribute to the greater good of the group which was what happened during...
Curated OER
A Picture's Worth a Thousand Words
High schoolers analyze the numbers of male vs female administrators and teachers from their school. In this gender equality lesson plan, students use school yearbooks from the 1950's threw present to count how many male vs. female...


