Curated OER
Math Journal: Functions and Coordinate Geometry
Fifth graders examine the many uses of coordinate grids. In this graphing lesson, 5th graders write data driven equations, discuss the x and y-axis, and determine if using 2 or 3 ordered pairs is better. Students complete several...
Curated OER
Transformations of Functions 2
Solving problems on the TI graphing calculator can be quite easy. Students observe the properties of transformation of functions and create a formula for the transformation.
Curated OER
Introduction to Functions
Learners explore functions, function rules, and data tables. They explore terms of linear functions. Students use computers to analyze the functions. Learners write short sentences to explain data tables and simple algebraic expressions.
Curated OER
Functions & Algebra
Students examine linear equations. In this functions and algebra lesson, students write equations in the slope-intercept form. They enter data in a graphing calculator, examine tables, and write linear equations to match the data.
Curated OER
Continuous Probability Distributions
In this continuous probability distribution instructional activity, students identify discrete and continuous distributions. They calculate the linear combination of the independent normal random variable and determine probabilities...
Curated OER
Relations and Functions
Students differentiate between a relation and a function. In this algebra lesson plan, students identify a pair of coordinates as being a relation or a function. They analyze graphs for function as they solve word problems.
Curated OER
Patterns, Functions, and Algebra: Wired for Space
Students assess how patterns, functions and algebra can assist NASA engineers design new ways of propelling spacecrafts. They explore how electricity and magnetism are replacing the fuel-consuming rocket propulsion. Electromagnetism is...
Curated OER
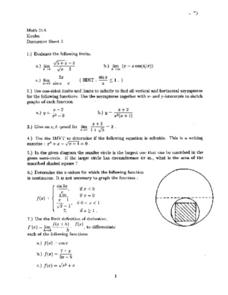
Discussion Sheet 4: Limits & Differentiation
In this limits and differentiation worksheet, students use the limit definition of a derivative to compute functions, and differentiate functions. They determine the geometric significance of values and identify the sketch of a...
Curated OER
Challenge Discussion Sheet 3
In this function worksheet, students prove given limits, solve differentiate functions, identify points on a graph with tangent lines passing through given points, determine the radius of a largest sphere that can fit inside of a pyramid...
Curated OER
Discussion Sheet 3: Limits
In this limit worksheet, students evaluate limits and use asymptotes and intercepts to sketch graphs of functions. They determine the area of inscribed shapes and use the limit definition of a derivative to differentiate functions. ...
Curated OER
Math TODAY - Breast Cancer Risks
Learners explore data that be modeled by a logistic function. They have the opportunity to study real-life data and create a mathematical function to model the data and make a prediction.
Illustrative Mathematics
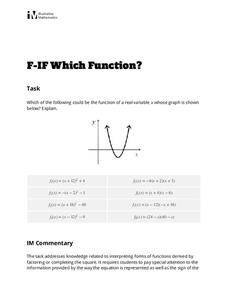
Which Function?
Learners are given a graph of a parabola on a coordinate system, but intercepts and vertex are not labeled. The task is to analyze eight given quadratic functions and determine which ones might possibly be represented by the graph. The...
EngageNY
Patterns in Scatter Plots
Class members investigate relationships between two variables in the seventh installment of a 16-part module that teaches scholars how to find and describe patterns in scatter plots. Young mathematicians consider linear/nonlinear...
Illustrative Mathematics
Temperature in Degrees Fahrenheit and Celsius
Scholars develop the conversion formulas between Fahrenheit and Celsius with a task that presents the class with two known temperature equivalents between the two scales. Pupils use those two points to develop the linear conversion...
Howard County Schools
Generous Aunt
Witness the power of exponential growth with an activity that investigates two different savings plans. Class members create tables of values to see how and when a savings plan increasing exponentially exceeds one increasing linearly.
Virginia Department of Education
Determining Direct Variation
Once learners realize what direct variation is, they see it's just a type of linear function. The lesson poses a general question that leads to the creation of the y = kx formula. The resource includes discussion prompts and ideas for...
Illustrative Mathematics
Temperature Conversions
Complete two conversions at once using compositions. Pupils use the conversion formulas for temperatures to calculate a formula to convert directly between Kelvin and Fahrenheit. Classmates determine the meanings of composition notation...
Shodor Education Foundation
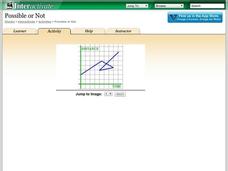
Possible or Not?
What does the graph mean? Pupils view 10 graphs and determine whether they are possible based on their contexts. The contexts are distance versus time and profit versus time.
Ohio Literacy Resource Center
Solving Systems of Linear Equations Graphing
Do you need to graph lines to see the point? A thorough lesson plan provides comprehensive instruction focused on solving systems of equations by graphing. Resources include guided practice worksheet, skill practice worksheet, and an...
Curated OER
The Very Hungry Caterpillar
A good book deserves to be followed up by a good worksheet. Here is a great resource which is intended for use after reading The Very Hungry Caterpillar by Eric Carle. It includes several activity ideas that promote skill development in...
Radford University
Fuel Efficient Function Activity
Pupils research the five most fuel efficient vehicles of the same type and come up with a way to display the mile per gallon for each vehicle. After choosing a vehicle, scholars create graphs to display miles traveled given the amount of...
Curated OER
Functions
Students explore a variety of functions. They recognize and describe functions and use linear functions to describe situations. Students find the domain and range of linear functions and graph rational expressions.
Curated OER
Graphing Linear Functions - Review
Pupils graph linear functions. They plot three points, create a line, and discuss methods to find the slope of line. In groups, students solve problems, graph their lines and find the slope of a line using various methods. Upon...
Illustrative Mathematics
Riding by the Library
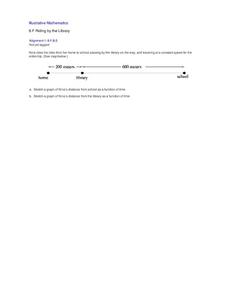
Draw a graph that shows the qualitative features of a function that has been described verbally. Make sure learners understand where time is zero and the distance is zero. It may take them some time to understand this concept, so working...


