National Geographic
National Geographic: The Politics of Place Naming
Learners use an online geographic information system (GIS) to uncover the geographic and social context of streets named after Martin Luther King, Jr. They map street locations to identify regional patterns in honoring King, consider...
Science Education Resource Center at Carleton College
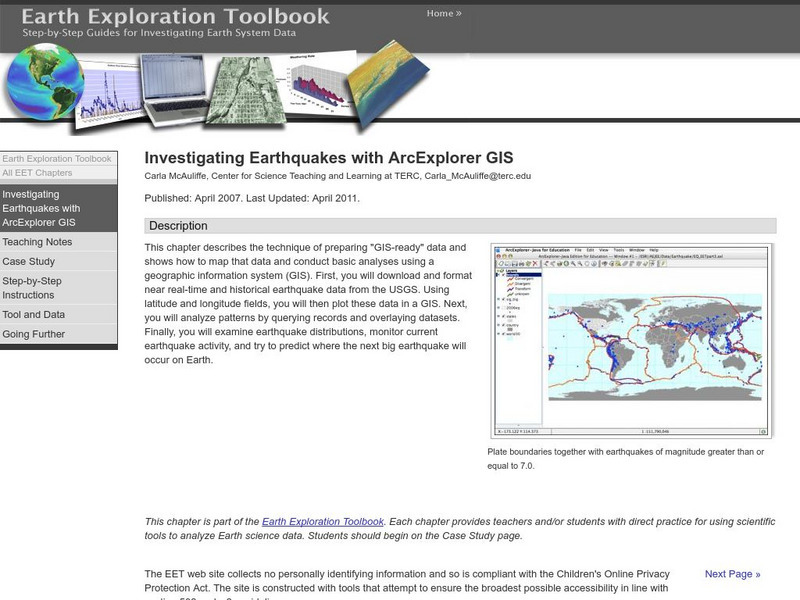
Serc: Investigating Earthquakes With Arc Explorer Gis
This activity allows students to predict future earthquake activity by interpreting the results of geographic information system (GIS) analysis.
Science Education Resource Center at Carleton College
Serc: Exploring Ncar Climate Change Data Using Gis
With ArcGIS and climate data from the National Center for Atmospheric Research Climate Change Scenarios GIS Data Portal, students learn the basics of GIS-based climate modeling.
Science Education Resource Center at Carleton College
Serc: Gis Exploration Using the High Plains Aquifer Databases
Students work with databases and GIS to develop saturated thickness maps. Each database consists of observations made by drillers where they have encountered the High Plains aquifer base and the annual water-level measurements taken in...
Science Education Resource Center at Carleton College
Serc: Using Gis to Map Emergency Response to Municipal Flooding
In this lesson students will work with municipal data and computer mapping to determine the priorities of emergency response to flooding in a local town. This can be used as a lab activity or as a group or individual project, and can be...
TeachEngineering
Teach Engineering: Projections and Coordinates: Turning a 3 D Earth Into Flatlands
Projections and coordinates are key advancements in the geographic sciences that allow us to better understand the nature of the Earth and how to describe location. These innovations in describing the Earth are the basis for everything...
TeachEngineering
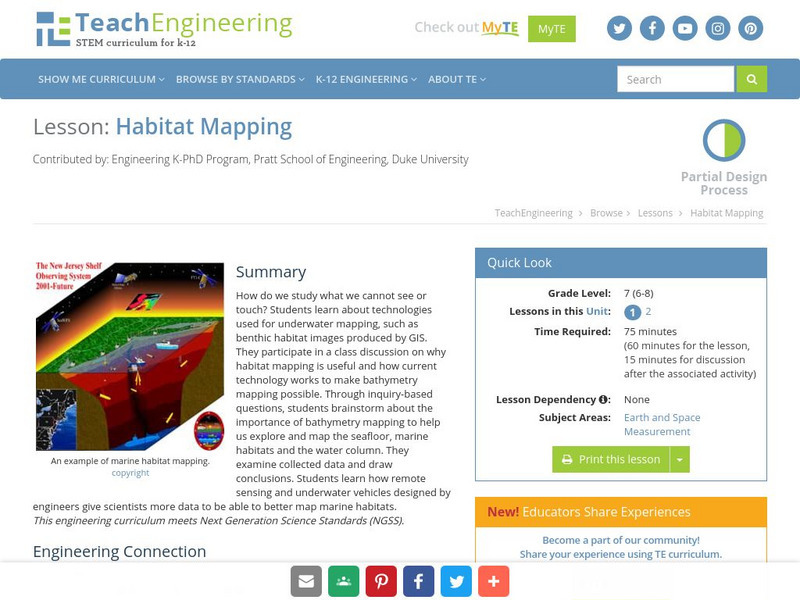
Teach Engineering: Habitat Mapping
The marine environment is unique and requires technologies that can use sound to gather information since there is little light underwater. In this lesson, the students will be shown benthic habitat images produced by GIS. These images...
American Geosciences Institute
American Geosciences Institute: Earth Science Week: Mapping Quake Risk
Students use GIS to observe worldwide patterns of earthquakes and volcanoes and analyze the relationships of those patterns to tectonic plate boundaries. Then they identify cities at risk.
Science Education Resource Center at Carleton College
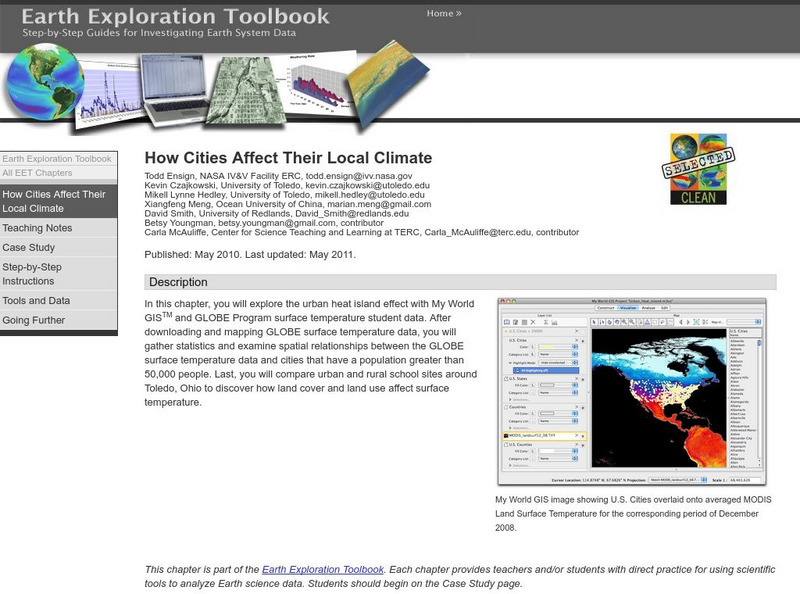
Serc: How Cities Affect Their Local Climate
Students explore the urban heat island effect with My World GISTM and GLOBE Program surface temperature student data. After completing this chapter, students will be able to successfully download GLOBE Program datasets in the...
Science Education Resource Center at Carleton College
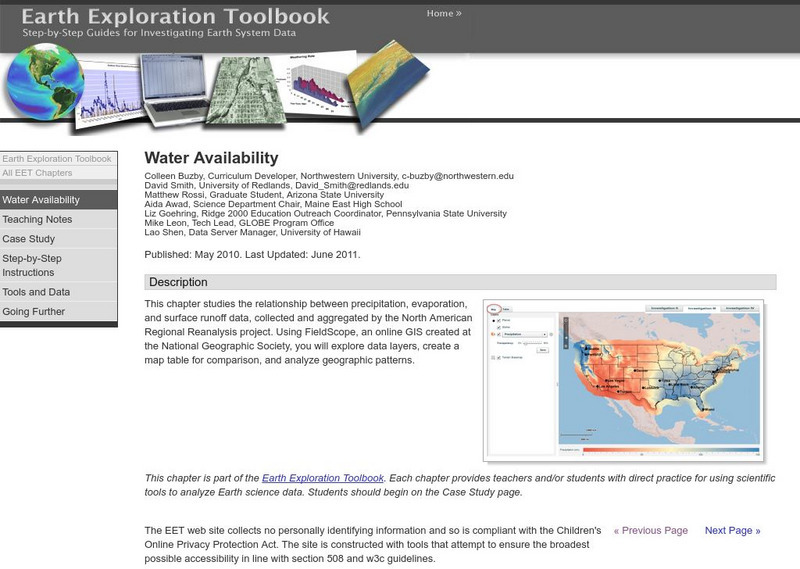
Serc: Water Availability
This lesson helps young scholars discover the relationship between precipitation, evaporation, and surface runoff data. Using FieldScope, an online GIS created at the National Geographic Society, students will explore data layers, create...
Science Education Resource Center at Carleton College
Serc: Investigating the Ocean Algal Blooms
This NOAA computer-based activity is designed to teach students in grades 9-12 how satellite imagery and remote sensing can be used to monitor harmful algal blooms (HABs). This lesson teaches students how to read and interpret satellite...
TeachEngineering
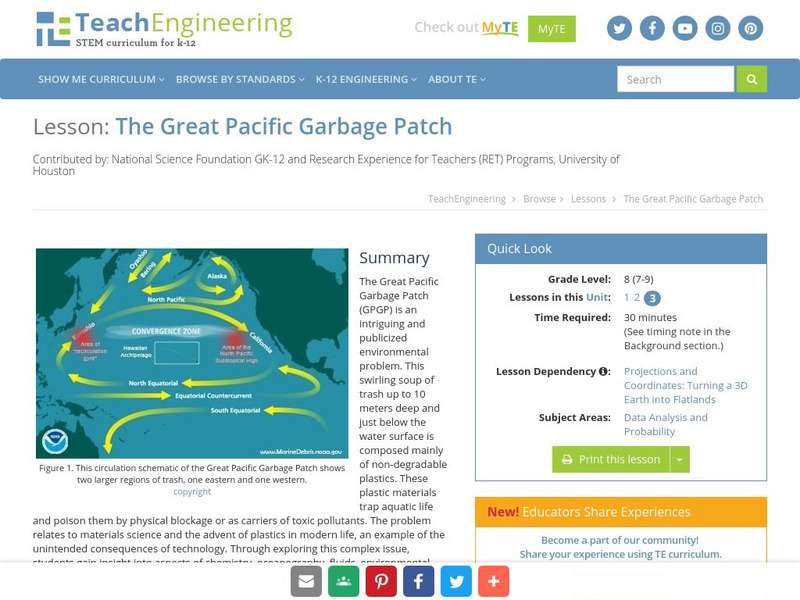
Teach Engineering: The Great Pacific Garbage Patch
The Great Pacific Garbage Patch (GPGP) is an interesting and somewhat publicized environmental problem. A swirling soup of trash up to 10 meters deep and just below the water surface is composed mainly of non-degradable plastics. These...
TeachEngineering
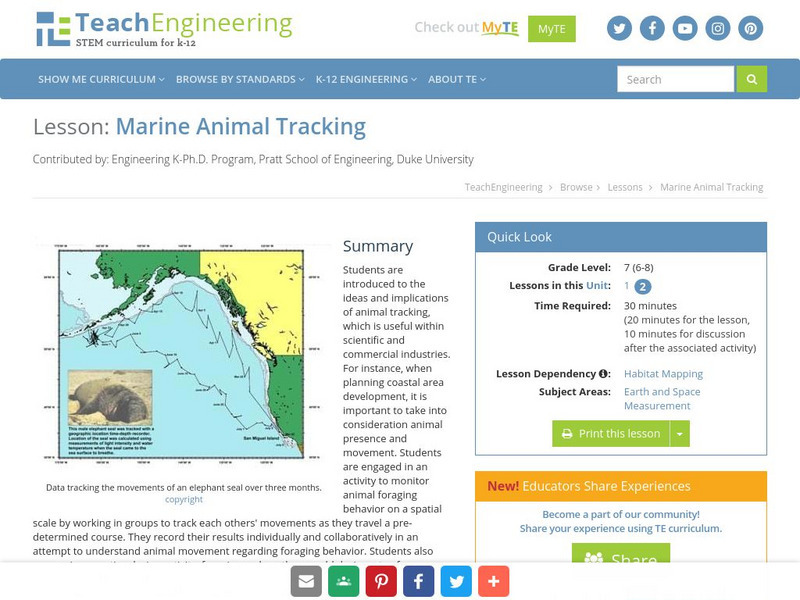
Teach Engineering: Marine Animal Tracking
This lesson engages students in an activity to monitor animal foraging behavior on a spatial scale. The students will break into groups and track each other's movements as they move through a pre-determined course. The results will be...
Science Education Resource Center at Carleton College
Serc: Detecting El Nino in Sea Surface Temperature Data
Through data analysis and observations of patterns, students learn about normal seasonal sea surface temperature variation as well as extreme variation, as in the case of El Nino and La Nina events, in the equatorial Pacific Ocean.
Other popular searches
- Gis Data
- Gis Map
- Gis Software
- Gis Environment
- Gis and Gps Technology
- Gis Gps
- Gis and Remote Sensing
- Gis Data Map
- Geography, Gis
- Gis Lesson Plans
- Gps/gis
- Gis Water


