Teach Engineering
What is GIS?
Is GIS the real manifestation of Harry Potter's Marauders Map? Introduce your class to the history of geographic information systems (GIS), the technology that allows for easy use of spatial information, with a resource that teaches...
Curated OER
Water Quality and Watersheds: A GIS Investigation
Requiring more than one class period, this resource takes earth science learners on a journey through a watershed. Using ArcGIS Explorer, an online geographic information system, they view maps of watersheds and surrounding landscapes....
Curated OER
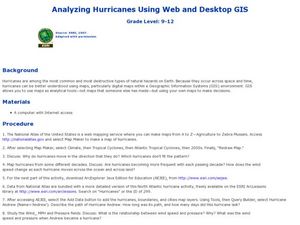
Analyzing Hurricanes Using Web and Desktop GIS
Students analyze hurricanes. In hurricanes lesson, students use the Internet and GIS to analyze hurricanes. Students view the National Atlas of Maps to discuss the direction hurricanes move. Students study the wind and pressure fields to...
NASA
Data Literacy Cube: Global Atmospheric Temperature Anomaly Data
Evaluate global temperature anomalies using real-world data from NASA! Climatologists analyze a data set using a literacy cube and differentiated question sheets. Team members evaluate global temperature anomaly data with basic...
Curated OER
Changing Planet: Permafrost Gas Leak
Pair earth scientists up to use an amazing online arctic portal mapping tool and Google Earth to analyze permafrost changes. They compare changes to data on atmospheric concentrations of methane to see if there is a correlation. Then...
Curated OER
Data Processing
Students explore the application of Geographic Information Systems (GIS) in a variety of businesses and organizations. They present proposals, representing different businesses and organizations, that support how GIS technology could...
Curated OER
GIS: Mapping Watersheds of the Edwards Aquifer in Travis County
Students manipulate existing GIS data to create and map a new layer of information that shows that watersheds in Travis County that are on top of Edwards Aquifer. They create and map that shows the watersheds in Travis County that are on...
Curated OER
Using Maps to Make Public Health Descisions Case Study: Harmful Algal Blooms in the Gulf of Mexico
Students are introduced to GIS and its uses. Students participate as public health scientists to deliberate a course of action to explore possible research questions. Pupils interpret spatial data, and make predictions based on GIS data,...
Curated OER
Matrix Analysis of Networks
Explore the connection between a finite graph, a directed graph, and a matrix. Graph lines and identify the relationship of matrices in real-world scenarios. Then use this information to work with a partner to plan and design a town...
Curated OER
TE Lesson: Habitat Mapping
Students examine the current technologies used in mapping resources in the marine environment. They look at remote sensing, sounding, and underwater vehicles. They examine image from the benthic habitat produced by the GIS in order to...
Curated OER
GIS Mapping: Special Instructions for Using Digital Orthophotos
Students practice cartography using GIS technology. They create a map of Austin using GIS and aerial photos.
Curated OER
Geographic Information Systems
Students examine the concept of geographic information systems (GIS) and its basic components. They explore an application program using GIS technology and list the various uses for GIS.
Curated OER
Graphing and Analyzing Biome Data
Students explore biome data. In this world geography and weather data analysis instructional activity, students record data about weather conditions in North Carolina, Las Vegas, and Brazil. Students convert Fahrenheit degrees to Celsius...
Teach Engineering
Projections and Coordinates: Turning a 3D Earth into Flatlands
Introduce your class to map projections and coordinates, the basics for the work done in a GIS, with an activity that uses Google Earth to challenge learners to think about the earth's shape.
Curated OER
Fostering Geospatial Thinking: Space to Earth: Earth to Space (SEES)
Students locate and access data to help them with their science inquiry. In this geographical positioning activity students evaluate and compare data sets.
Curated OER
Exploring Wyoming Species Habitats
Students are introduced to the concept of species habitats and ranges. They introduced to ArcView GIS as a tool for mapping. Pupils use query data for species withina county, elevation, range, rivers and streams, land cover, and etc....
Curated OER
Using GLOBE Data to Study the Earth System (College Level)
Students use the GLOBE Website to locate and study environmental data. They use the GLOBE Graphing Tool to display data. Students describe the role of solar energy in the annual fluctuations of soil moisture. They describe reservoirs and...
Curated OER
Investigating Earthquakes: GIS Mapping and Analysis
Students describes the technique of preparing "GIS-ready" data and shows how to map that data and conduct basic analyses using a geographic information system (GIS).They use latitude and longitude fields to plot the data in a GIS and...
Curated OER
Mapping Lab and Lead Poisoning
Students are introduced to GIS and its uses. They make predictions before viewing the actual lead poisoning cases by location of Dade County. Pupils use actual Miami-Dade County spatial data to explore basic principals. Students
Curated OER
Calculating Impervious Cover in the City of Austin
Students use GIS to calculate park impervious cover in Austin, TX. They consider that there are different types of impervious cover from hard, packed dirt to cement paving. Students consider the limitations of data in several areas...
Curated OER
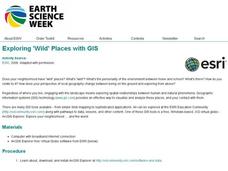
Exploring 'Wild' Places With GIS
Learners explore "wild" places. In this technology lesson students use ArcGIS Explorer to investigate wild places near them in their neighborhood. Learners view the landscape from both above and the ground.
Curated OER
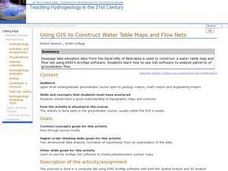
Using GIS to Construct Water Table Maps and Flow Nets
Students examine how to use GIS software to analyze patterns of groundwater flow. Seepage lake elevation data from the Sand Hills of Nebraska is used to construct a water table map and flow net using Esri's Arc Map software.
Curated OER
Geographic Information Systems (GIS) and Water Resources
Students demonstrate how water quality and environmental health issues can be analyzed together, how hydrologic information can be built up, and how decisions can be made using GIS.
Curated OER
Hagerman GIS Questions
Students examine maps and pictures to identify specific geographic information. In addition, they explore data tables and GIS data to identify fossil beds and vegetation. Students explore the correlations between soil type, vegetation,...


