GeoGebra
GeoGebra Graphing Calculator
So, exactly, what does it look like? The easily usable graphing calculator allows pupils to visualize the graph of equations and inequalities. The interactive supports any algebraic graph needed for high school mathematics and then some.
Curated OER
Graphing Stories Ice Breaker
Kick off the school year with some math fun! New classmates share information about themselves by using graphs and interpreting data. The goal is to use a general graph shape, such as linear or exponential, and create labels for the axes...
Shasta County Office of Education
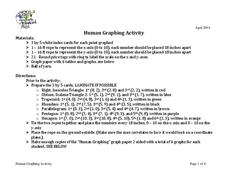
Human Graphing Activity
Take graphing outside and make a giant coordinate plane to plot your human points. Young graphers are each given a coordinate for a particular shape and asked to make the geometrical shapes one by one. Those not plotted are to write down...
Scholastic
Study Jams! Choosing the Correct Graph
With so many types of graphs, don't let your learners get stuck figuring out which one to use. To track how Zoe spent her allowance, use this interactive lesson to review all the types of graphs and pick the best one to display the data....
Mathematics Assessment Project
Linear Graphs
A line is a line is a line. As a middle school assessment task, learners first identify graphs of given linear equations. They then identify the equations that represent real-world situations.
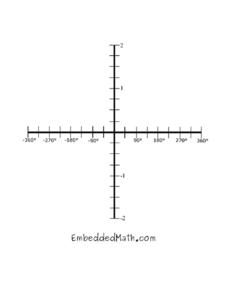
Embedded Math
Trig Graph
You and your learners will enjoy having many copies of this trigonometric graph set on the Cartesian coordinate grid with a domain running from -360 degrees to 360 degrees and a range running from -2 to 2.
Curated OER
Building Brilliant Bar Graphs
Everything you need for a mini-unit on bar graphs is included in this lesson plan! It outlines three lessons and includes worksheets. Learners taste pretzels, shoot baskets (switching off hands), and grab candy, graphing results...
Curated OER
Identifying Linear Functions from Graphs
Keep your mathematicians engaged using this group linear functions activity. Each of ten groups receives two graphs with both an image and equation, as well as a "who has" phrase to call out the next graph. Scholars stay on their toes as...
Curated OER
Bar Graphs With Intervals
Give your math class a comprehensive understanding of bar graphs with this series of lessons. The resource is divided into three parts, and all of the accompanying worksheets are included. The class will study different bar graphs,...
Curated OER
Great Graph!
Here is a fantastic activity counting coins, interpreting graphs, and the concept of "greater than" and "less than." Young mathematicians utilize worksheets embedded in the plan in order to practice these concepts. The worksheets are...
Mathematics Assessment Project
Interpreting Distance–Time Graphs
Pre-algebra protégés critique a graph depicting Tom's trip to the bus stop. They work together to match descriptive cards to distance-time graph cards and data table cards, all of which are provided for you so you can make copies for...
Scholastic
Study Jams! Bar Graphs
Mia teaches Sam how to create a bar graph, including forming a title, creating and labeling the axes, choosing a scale, and entering data. After viewing, data analysts can test themselves with seven follow-up questions and review...
Curated OER
Narnia Bar Charts
Here is a fabulous presentation that combines math and literature. Learners construct bar charts and frequency charts about things that happen in Narnia. Student pairs are assigned tasks regarding the variety of characters found in the...
Wordpress
Equation Table Graph
Your Algebra learners will appreciate this fabulous, two-page printable. The first page has a list of numbers that lead to the learners writing an equation in a cloud that represents these numbers, and then filling in a table, and...
Jude Mphoweh
Graphs
Searching for worksheets to include in an elementary math series on bar graphs? Then look no further! This collection of materials has exactly what you need to ensure that your students get plenty of practice reading and analyzing the...
Shodor Education Foundation
Graph Sketcher
Sketch graphs with the Graph Sketcher. Scholars graph functions on a coordinate plane. An interactive makes it as easy as inputting the function and clicking a button.
Mathed Up!
Distance Time Graphs
If only there was a graph to show the distance traveled over a period of time. Given distance-time graphs, pupils read them to determine the answers to questions. Using the distance and time on a straight line, scholars calculate the...
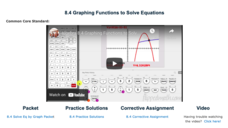
Flipped Math
Graphing Functions to Solve Equations
Intersections become solutions. Scholars watch a video on using a graphing calculator to find the solution to an equation in one variable. While watching the presentation, pupils practice working some of the examples and compare their...
Teacher's Corner
Favorite Dr. Seuss Book Graph
What's your class' favorite Dr. Seuss book? Find out using this book graph that lists nine different titles and asks participants to indicate their favorite. Results are then tallied and graphed.
Curated OER
What's in a Graph?
How many yellow Skittles® come in a fun-size package? Use candy color data to construct a bar graph and a pie chart. Pupils analyze bar graphs of real-life data on the Texas and Massachusetts populations. As an assessment at the end of...
Curated OER
Five Colors Bar Graph-Make a Bar Graph
Two worksheets are provided here that contain the same information but ask different questions. The first worksheet has the learner draw the graph themselves before answering the questions that follow, and the second worksheet has the...
Willow Tree
Graphing
So many methods and so little time! The efficient method of graphing a linear equation depends on what information the problem gives. Pupils learn three different methods of graphing linear equations. They graph equations using...
EngageNY
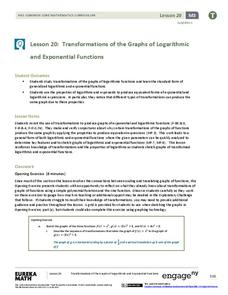
Transformations of the Graphs of Logarithmic and Exponential Functions
Transform your lesson on transformations. Scholars investigate transformations, with particular emphasis on translations and dilations of the graphs of logarithmic and exponential functions. As part of this investigation, they examine...
EngageNY
Revisiting the Graphs of the Trigonometric Functions
Use the graphs of the trigonometric functions to set the stage to inverse functions. The lesson plan reviews the graphs of the basic trigonometric functions and their transformations. Pupils use their knowledge of graphing functions to...
Other popular searches
- Coordinate Graphing Pictures
- Charts and Graphs
- Graphic
- Graphic Organizers
- Graphing Ordered Pairs
- Bar Graphs
- Circle Graph
- Vertex Edge Graph
- Graphing Skills Lesson Plans
- Graphic Design
- Line Graphs
- Double Bar Graph


