Curated OER
Interpreting a Bar Chart
For this interpreting bar charts worksheet, students examine a bar chart that shows how many people traveled on boats that took them out dolphin watching. They answer 8 questions about the times and number of people on the boats.
Curated OER
Topic 2.2 - Graphing Linear Equations
For this linear equation worksheet, students write 9 linear equations in Standard Form. They then find the x and y-intercept of the graph of each of 6 equations. Finally, students graph 6 equations on the blank graphs provided on the page.
Curated OER
Line Graph: To Grandmother's House We Go
In this line graph worksheet, students use a line graph showing distance traveled to answer a set of 4 related questions. Answers are included on page 2.
Curated OER
Mean, Mode and Bar Graphs
In this mean, mode and bar graphs worksheet, 5th graders analyze the data given, then answer three questions about a bar graph and the data shown.
Curated OER
Every Graph Tells A Story
Seventh graders explore linear equations. In this graphing lesson, 7th graders explore constant rates of change. Students discover the real-life application of graphs and demonstrate their ability to read graphs and write corresponding...
Curated OER
Reading and Interpreting Graphs Worksheet
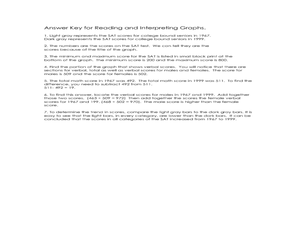
In this bar graphs instructional activity, students read and interpret a bar graph on SAT scores by answering short answer questions. Students complete 7 questions total.
Curated OER
Misleading Graphs
Students explore number relationships by participating in a data collection activity. In this statistics instructional activity, students participate in a role-play activitiy in which they own a scrap material storefront that must...
Curated OER
Creating Graphs from Tables
Students interpret data from tables and then create a graph to show the same data in a different organization.
Curated OER
Immigration and American Life Graphing Immigration Data
Young scholars practice graphing immigration data from the Caribbean. After practicing making their own graphs, they make the final graph and label it accordingly. They work together to determine the six most populated states of...
Curated OER
Graphing Linear Functions
Seventh graders identify the use of a function.They are asked to describe the input and output of a function. Students also identify different aspects of the coordinate system and represent functions in a visual graph.
Curated OER
Bar Charts and Pictographs: How can they help us?
First graders work with manipulatives to solve various math problems by using concrete objects to solve a list of problems . They create and evaluate bar graphs and write a statement about the information on their bar graph.
Curated OER
Horizontal Bar Graph-- Blank Grid
In this math activity, students use the blank horizontal bar graph to record and display any data and to learn the correct way to generate a bar graph. Spaces are marked for students to write in the title and labels; intervals of 1-10...
Curated OER
Graphing Inequalities
In this graphing inequalities worksheet, learners complete 8 inequality tables. Students then graph and shade the 8 inequalities on a coordinate plane.
Curated OER
Class Trip: Circle Graphs
In this circle graph learning exercise, students fill in a graph showing given percentages about a class trip and explain why a circle graph would be used, then compete another circle graph with different given information.
Curated OER
Activity: Make a Bar Graph
In this bar graph worksheet, students use a given picture to create a graph, then use the graph to solve 2 related problems. Graph is sports related.
Curated OER
Problem-Solving Application: Use Circle Graphs
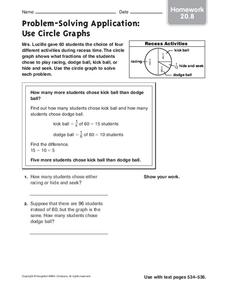
In this problem solving worksheet, students analyze the information in a circle graph about recess activities. Students use this graph to solve 2 application problems.
Curated OER
Problem-Solving Application: Use Circle Graphs
In this problem-solving worksheet, 5th graders problem-solve 2 mathematical equations involving 4 key steps and 2 circle graphs.
Curated OER
Graph Functions with Integers
Fifth graders can do a quick review of graphing functions using integers with this worksheet. The worksheet has questions which require students to identify the pertinent information in a word problem, and create a graph to represent the...
Curated OER
Problem Solving: Graphing Functions
In this graphing functions activity, students solve 6 word problems, finding ordered pairs, missing coordinates and numbers, slopes of lines and functions.
Curated OER
Graph Related Linear Inequalities
Students explore the concept of linear inequalities. In this linear inequality lesson, students graph linear inequalities using Microsoft Excel.
Curated OER
Frequency Histograms, Bar Graphs and Tables #3
In this frequency histograms worksheet, students examine bar graphs, histograms and tables. They identify the model of information that best matches the statistics. This three-page worksheet cotnains two multiple-choice problems. ...
Curated OER
Create a Bar Graph
In this bar graph activity, students use a set of clues about favorite types of books to draw the bars on a graph. Answers are included on page 2.
Curated OER
Bar Graph Activity: Spelling Bee
In this bar graph worksheet, students use information about a class spelling bee, shown in a bar graph, to complete a set of 7 related questions. Answers included on page 2.
Curated OER
Charts and Graphs
In this charts and graphs worksheet, students refer to charts and graphs to solve word problems. Students complete 10 multiple choice word problems.
Other popular searches
- Coordinate Graphing Pictures
- Charts and Graphs
- Graphic
- Graphic Organizers
- Graphing Ordered Pairs
- Bar Graphs
- Circle Graph
- Vertex Edge Graph
- Graphing Skills Lesson Plans
- Graphic Design
- Line Graphs
- Double Bar Graph


