Urbana School District
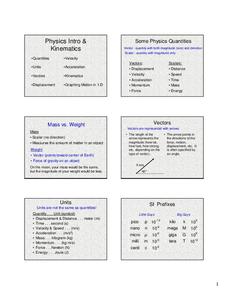
Physics Intro, Kinematics, Graphing
Some consider physics the branch of science concerned with using long and complicated formulas to describe how a ball rolls. This presentation, while long, is not complicated, yet it covers rolling, falling, and more. It compares vectors...
Curated OER
What's in a Graph?
Students explore how to use and interpret graphs. The graphs are pulled from a variety of sources, and the activities ask students to interpret graphs. They start this lesson with knowledge of what a graph is. Students also know how to...
Curated OER
Learning to Read Graphs 2
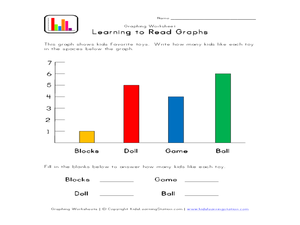
Do you like playing with blocks, dolls, games, or balls? Use this basic graph to review bar graphs with young learners. After completing the four questions below, consider creating your own class graph: who likes blocks the best? Who...
Curated OER
Learning to Read Graphs
What is your favorite pet? This is a great tool for youngsters just learning how to read and interpret graphs. There are four simple questions. Consider extending this activity by creating a class bar graph: how many learners have a dog,...
Curated OER
Reading Graphs with a Logarithmic Scale
Guide high school meteorologists through a detailed examination of oxygen concentration data. The learners analyze a line graph containing logarithmic data and employ the use of a graphing calculator. A comprehensive worksheet and links...
Curated OER
Graphing Toys!
Jason, Michelle, Sofia, and Willis all have a variety of toys. Use the chart provided to graph how many toys each child has. Who has the most toys? Who has the least? Help your learners study the graphs they create to better understand...
Curated OER
Graphing the Population Explosion of Weeds
Students are introduced to the seed cycle and draw the specific steps. In groups, they identify the human barriers to the spreading of weeds. After calculating the rate of spreading of the Yellowstar Thistle, they create graphs to see a...
Curated OER
Graphing the Temperature within the Atmosphere
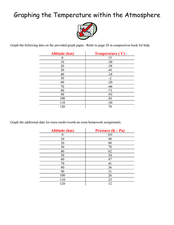
Musing meteorologists design graphs of the temperature and pressure changes for altitude increase in our atmosphere. The activity is pertinent to middle school earth science curriculum. Vary the type of homework you assign when teaching...
Curated OER
Graph Paper Patterns
Young artists divide a piece of graph paper into sections using rectangles, squares, and triangles. They then fill each section with patterns of shape and color. Elementary graders describe how their patterns are organized. Secondary...
Curated OER
Twenty-Seven Graphing Lines, Parabolas, and Absolute Value Problems
Have learners find coordinates of point on a graph, find equations of graphs given, and graph given equations using in and out tables. There are 27 problems related to equations for lines, parabolas, and absolute value functions.
Curated OER
Graphs
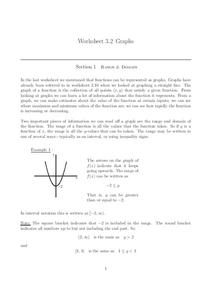
In this graphs worksheet, students solve and complete 15 various types of problems. First, they determine the range of the function of the graph shown and write in interval notation. Then, students find the domain of the function in the...
Curated OER
Correlation of Variables by Graphing
Middle and high schoolers use a spreadsheet to graph data. In this graphing lesson plan, learners determine how two parameters are correlated. They create a scatter plot graph using a computer spreadsheet.
Mt. San Antonio Collage
Quadratic Functions and Their Graphs
Starting with the basics, learners discover the features of a parabola and the ways to accurately graph it. After pupils practice with graphing, the end of the learning exercise focuses on application type problems.
Mt. San Antonio Collage
Graphs of Rational Functions
Sometimes graphing rational functions can feel a little "irrational." Starting with the basics, learners work their way through the pieces of these graphs and finish off with an application question.
Curated OER
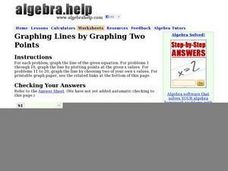
Graphing Lines by Graphing Two Points
Use a graphing lines instructional activity to have your mathematicians graph the line of a given equation and plot specified points. The first 10 problems have a given equation, and two values. The next 10 problems have a given...
EngageNY
Interpreting Quadratic Functions from Graphs and Tables
Seeing functions in nature is a beautiful part of mathematics by analyzing the motion of a dolphin over time. Then take a look at the value of a stock and maximize the profit of a new toy. Explore the application of quadratics by...
Curated OER
Graphs: Number of Cans Collected
Who collected the most recyclables? Learners read the vertical bar graph and answer the eight questions that follow. Review the terms fewer and combined before sending your class on its way.
Houston Area Calculus Teachers
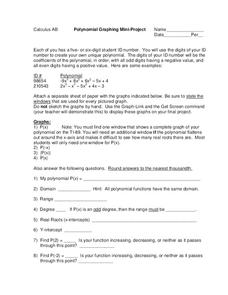
Polynomial Graphing
Your AP Calculus learners probably have their ID numbers memorized, but have they tried graphing them? Pique your pupils' interest by asking each to create a unique polynomial function based on their ID numbers, and then analyze the...
Worksheet Place
How I Get to School
Find out how many of your learners take the bus, how many walk, and how many bike with a quick survey. Class members gather data about how each individual gets to school and mark the results on this page in order to create a bar graph.
Curated OER
Graphing Exponential Functions
Explore the concept of graphing exponential functions. High school mathematicians are given exponential functions such as y=2*3^x, and they graph them on a coordinate plane. They are given two exponential graphs and must write an...
Flipped Math
Calculus AB/BC - Sketching Graphs of Functions and Their Derivatives
Find deeper meaning in graphs. Pupils use the knowledge gained from the previous sections in the unit to sketch graphs of a function's derivative. Learners also see how to sketch a graph of a function given the graph of its derivatives....
Curated OER
Conversation Heart Graphing
Sixth graders review the different types of graphs (bar, line, pictograph) They predict the data set they can garner several boxes of conversation hearts. Students record their data using an Excel spreadsheet. They create a graph based...
EngageNY
Graphs of Quadratic Functions
How high is too high for a belly flop? Learners analyze data to model the world record belly flop using a quadratic equation. They create a graph and analyze the key features and apply them to the context of the video.
Curated OER
Graph Picture (Coordinate Pairs)
Coordinate graphing on a grid is the focus of this worksheet. Young mathematicians plot 42 coordinate pairs on a graphing grid, then connect the dots to make a picture. A fun way to get your learners involved in graphing!
Other popular searches
- Coordinate Graphing Pictures
- Charts and Graphs
- Graphic
- Graphic Organizers
- Graphing Ordered Pairs
- Bar Graphs
- Circle Graph
- Vertex Edge Graph
- Graphing Skills Lesson Plans
- Graphic Design
- Line Graphs
- Double Bar Graph


