WK Kellogg Biological Station
Plotting Phenology
Finally, a worksheet that involves more than filling in some blanks. Your budding ecologists must graph and analyze three sets of data, then synthesize the information as they think about the impacts of plant reproduction on insects and...
Curated OER
Invasives and Macroinvertebrates
Students view macroinvertebrates, or discuss previous collection activity. They graph data on macroinvertebrates in the Hudson River. Students discuss the relationship between habitat, environmental changes, and invertebrate diversity or...
Curated OER
Exploring Complex Roots
In exploring the concept of complex roots, students find the axis of symmetry and roots of parabolas. Then, they discuss what makes a solution complex and how to identify functions with complex roots.
Curated OER
Rain Forests: A Disappearing Act?
Students examine and locate rainforests on maps, and research the patterns of their destruction. They develop a bar graph of rainfall and temperature data, write a journal entry, and research the people, animals, and plants/products of...
Curated OER
Zebra Mussel Population Simulation
Students are taught how to format and enter data into an Excel spreadsheet. They make a graph, and interpret graphed data. Students discuss the possible impacts of zebra mussels on the Hudson river. They graph zebra mussel data.
Curated OER
Dissolved Oxygen and Temperature
Students are shown how temperature affects dissolved oxygen and they create a graph showing this relationship. They think about the adaptations of animals to live in different water temperatures. Students test four different water...
Curated OER
The Origins and Maintenance of Earth's Atmosphere
In this atmosphere worksheet, students read over a data table showing the percentage of carbon dioxide, oxygen and nitrogen in the atmosphere over the last 4500 million years. Students create a graph comparing these gases over time and...
Curated OER
Recording Local Weather
Second graders measure, record, graph, and report changes in local weather using Navajo, Ute, and Spanish words for weather conditions. They record the weather results on a graph, and create drawings of weather conditions.
Curated OER
Don't Lose Your Load!
Students create graphs using collected data. In this algebra lesson, students use spreadsheet in Excel to create graphs to interpret their data and make predictions. They rewrite word problems using algebraic expressions.
Curated OER
Human Populations Studies: the Ghost of Populations Past
Students compile data on population distribution and develop survivorship curves using information from cemetery tombstones and obituaries. They develop inferences on the changes in population age distribution in their area over time.
Curated OER
Populations and Ecosystems
Sixth graders examine the factors that influence the stability of ecosystems. They construct a miniature ecosystem in a jar that includes plants, small fish, and snails, record the population changes over a period of four weeks, and...
Curated OER
Graph Made Easy-Pre Test Questions
In this graphing pre test worksheet, students complete a set of 10 multiple choice questions. Page is labeled as a pretest, an answer link is provided.
Curated OER
Unit III: Worksheet 3 - Uniform Acceleration
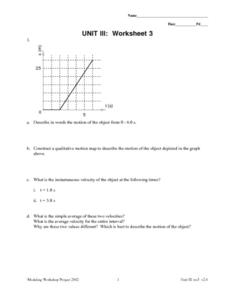
This three-page activity moves physics masters to show what they know about motion. They analyze graphs of time versus displacement, solve instantaneous and average velocities, solve word problems, and graph results. This is an...
Science 4 Inquiry
The Ups and Downs of Populations
As the reality of population decline across many species becomes real, pupils learn about the variables related to changes in populations. They complete a simulation of population changes and graph the results, then discuss limiting...
Noyce Foundation
Truffles
Knowing how to scale a recipe is an important skill. Young mathematicians determine the amount of ingredients they need to make a certain number of truffles when given a recipe. They determine a relationship between ingredients given a...
Curated OER
Graphical Analysis
Get out your TI-nspire graphing calculator and explore polynomials. Learners determine where a given polynomial are increasing or decreasing, find maximums, minimums, and zeros of polynomials, and discuss end behavior of polynomials....
EngageNY
The Computation of the Slope of a Non-Vertical Line
Determine the slope when the unit rate is difficult to see. The 17th part of a 33-part series presents a situation that calls for a method to calculate the slope for any two points. It provides examples when the slope is hard to...
Curated OER
Radiation Comparison Before and After 9-11
Using the NASA website, class members try to determine if changes could be detected in cloud cover, temperature, and/or radiation measurements due to the lack of contrails that resulted from the halt in air traffic after the attacks of...
The New York Times
Understanding the Mathematics of the Fiscal Cliff
What exactly is the fiscal cliff? What are the effects of changing income tax rates and payroll tax rates? Your learners will begin by reading news articles and examining graphs illustrating the "Bush tax cuts" of 2001 and 2003. They...
Curated OER
Sunrise, Sunset
What locations on Earth get the longest number of hours of daylight in the summer? Hint: It's not the equator! Use real-world sunrise and sunset data to develop trigonometric models that can be used to estimate the number of hours of...
EngageNY
Motion Along a Line – Search Robots Again
We can mathematically model the path of a robot. Learners use parametric equations to find the location of a robot at a given time. They compare the paths of multiple robots looking for parallel and perpendicular relationships and...
Curated OER
2nd Grade - Act. 23: Sprout Houses
Read the story "Sunflower House," by Eve Bunting with your 2nd graders to investigate the relationships between plants and animals. They will discover how living things change during their lives by creating their own sprout houses. In...
Curated OER
Teaching Reading Comprehension through Social Studies Readings
Examine how immigrants have changed the environment of the United States. Individually, middle schoolers will take a pre- and post-test to assess their reading comprehension. In groups, they compare and contrast the religions of...
Curated OER
Unit III: 3
In this unit III: 3 worksheet, students describe motion in words and graph drawings. Students calculate the instantaneous velocity and average velocity. Students also graph the displacement of the object in the word problems.


