EngageNY
Solution Sets to Inequalities with Two Variables
What better way to learn graphing inequalities than through discovering your own method! Class members use a discovery approach to finding solutions to inequalities by following steps that lead them through the process and even include...
GeoGebra
GeoGebra Graphing Calculator
So, exactly, what does it look like? The easily usable graphing calculator allows pupils to visualize the graph of equations and inequalities. The interactive supports any algebraic graph needed for high school mathematics and then some.
BW Walch
Solving Linear Inequalities in Two Variables
Although graphing a linear inequality on the plane is but a few steps added onto the graphing of a linear equation, for many learners the logical leap is quite intimidating. This approachable PowerPoint presentation breaks graphing...
Curated OER
Graphing Inequalities in Equations
Can a person solve and graph inequalities in one variable? Sounds impossible but it's not! Young mathematicians solve and graph inequalities in algebraic equations. They find a range of possible values for a variable as they solve...
Curated OER
Graphing Inequalities in One Variable
Students graph inequalities on a number line. In this algebra lesson plan, students solve linear and compound inequalities and graph them on a number line. They write an inequality given the number line with the solution on it.
Curated OER
Solving One-Step Inequalities by Adding/Subtracting
In this solving inequalities worksheet, students add and subtract to isolate the variable for 26 inequalities. Each solution is then graphed on a number line.
Curated OER
Graphing Inequalities
In this graphing inequalities worksheet, students solve and graph 10 different problems that include various inequalities. First, they study each of the examples given. Then, students graph the remaining equalities and inequalities as...
Virginia Department of Education
Solving and Graphing Inequalities
You can't go wrong with a lesson plan that involves candy! Learners solve and graph one-variable inequalities and use candy to graph the solution. Individuals associate open circle graphs with life savers and closed circle graphs with...
EngageNY
Writing and Graphing Inequalities in Real-World Problems
Inequalities: when one solution just doesn't suffice. Individuals learn to write inequalities in real-world contexts and graph solution sets on the number line. All inequalities in the lesson are of the form x < c or x < c.
Shodor Education Foundation
Linear Inequalities
An interactive lesson helps individuals learn to graph inequalities in two variables. Scholars can adjust the interactive to present the inequalities in standard or slope-intercept form.
Curated OER
Great Graph!
Here is a fantastic activity counting coins, interpreting graphs, and the concept of "greater than" and "less than." Young mathematicians utilize worksheets embedded in the plan in order to practice these concepts. The worksheets are...
EngageNY
Solving and Graphing Inequalities Joined by “And” or “Or”
Guide your class through the intricacies of solving compound inequalities with a resource that compares solutions of an equation, less than inequality, and greater than inequality. Once pupils understand the differences, the...
West Contra Costa Unified School District
Solving Systems of Inequalities
Don't throw away those transparency sheets just yet! Young scholars first review inequalities on a number line, then learn about graphing inequalities in the coordinate plane. Finally, they use overhead transparencies to create systems...
EngageNY
Solution Sets of Two or More Equations (or Inequalities) Joined by “And” or “Or”
English and math have more in common than you think. Make a connection between a compound sentence and a compound inequality with an activity that teaches learners the difference between an "and" and "or" inequality through solutions...
EngageNY
Solving Inequalities
Do properties of equations hold true for inequalities? Teach solving inequalities through the theme of properties. Your class discovers that the multiplication property of equality doesn't hold true for inequalities when multiplying by a...
Desmos
Desmos Graphing Calculator
They say a graph is worth a thousand points. The interactive allows users to graph a wide variety of functions and equations. Using the included keyboard or typing directly into the list, learners determine the graph of a function....
Curated OER
Graphing Inequalities
Students graph linear equations and then find the person in class whose linear equation graph is perpendicular to theirs. In this graphing inequalities lesson plan, students graph their perpendicular slopes and then once their find their...
Curated OER
Graphing Inequalities
Students solve inequalities and graph. In this algebra lesson, students rewrite inequalities in the slope intercept form and graph using the slope and intercept. They shade the correct side of the line using greater than or less than as...
Kuta Software
One-Step Inequalities
Here's a simple worksheet on solving and graphing inequalities for your algebra class. Learners solve 24 questions, graphing each on a number line. Numbers include fractions, integers, and negative numbers.
Virginia Department of Education
Give or Take a Few
Young mathematicians extend their knowledge of rational numbers on a number line to graph inequalities by first using number cards to compare rational numbers. They finish by using similar reasoning to graph inequalities on a number line.
Curated OER
Bar Graphs With Intervals
Give your math class a comprehensive understanding of bar graphs with this series of lessons. The resource is divided into three parts, and all of the accompanying worksheets are included. The class will study different bar graphs,...
Curated OER
Graphing Inequalities
In this graphing inequalities worksheet, learners complete 8 inequality tables. Students then graph and shade the 8 inequalities on a coordinate plane.
Curated OER
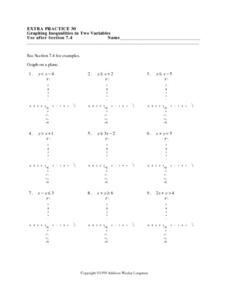
Graphing Inequalities in Two Variables: Extra Practice 30
In this math worksheet, students graph inequalities on a coordinate grid. The eight problems have a coefficient of one for the y variable. Three problems have a negative value for y. The final four problems are horizontal or vertical lines.
Curated OER
Graphing Inequalities in Two Variables
In this graphing inequalities worksheet, students shade 3 inequality problems. Students then graph and shade 4 additional inequalities.
Other popular searches
- Inequalities Graph
- Linear Inequalities Graph
- Combined Inequalities Graph
- Solve and Graph Inequalities


