Curated OER
Solving One-Step Inequalities by Multiplying/Dividing
In this pre-algebra worksheet, students solve and graph the results for 26 linear inequalities. Each problem involves either multiplication or division. Seven problems include a negative coefficient for the given variable.
Curated OER
Linear Inequalities
Ninth graders graph linear inequalities. In this Algebra I lesson, 9th graders examine the graph of a linear inequality and in a game format, test coordinates to determine the region of the graph that satisfies the inequality.
Curated OER
Graphs
Students participate in a activity exploring the concept of using graphs in various types of mathematical problems. They use negative and positive numbers in order to plot a graph. Students should use a place value chart for a reference...
Curated OER
Solving Linear Inequalities
In this linear inequalities learning exercise, 10th graders solve 10 different problems that include various forms of linear inequalities. First, they determine the relationship of the numbers. Then, students multiply or divide to get...
Curated OER
Solving Inequalities
In this solving inequalities worksheet, 9th graders solve and complete 7 different problems that include defining inequalities. First, they name each of the inequality signs and draw an example of each solution. Then, students determine...
Curated OER
Systems of Linear Inequalities in Standard Form -- Lecture
Students participate in a lecture about linear inequalities. Individually, they graph different inequalities and describe its solution. They participate in a demonstration in which they solve a system of inequalities and complete a...
Curated OER
Systems of linear inequalities in standard form
Learners practice graphing linear inequalities and explain their solution sets to the solving of a system of linear equalities graphically and symbolically. They utilize programming techniques in setting up and solving systems of linear...
Curated OER
Absolute Value Inequalities
Students solve inequalities. In this absolute value lesson, students solve inequalities containing absolute value. They graph the solution of each problem.
Curated OER
Systems of Linear Inequalities
In this systems of linear inequalities learning exercise, 9th graders solve 10 different problems that include various linear inequalities. First, they solve each equation for y. Then, students graph each individual inequality and locate...
Curated OER
Linear Inequalities
In this linear inequalities worksheet, 11th graders solve and complete 9 different problems that include various linear inequalities. First, they draw a number line to determine their equals portion and make the appropriate notation....
Curated OER
ACT Questions of the Day 5/21/08
In this ACT practice instructional activity, learners solve the ACT question of the day in which they select the graph that represents the inequality equation. There are 5 graphs to choose from.
Curated OER
Solving Inequalities
In this solving inequalities worksheet, 10th graders solve and complete 9 different problems that include defining various inequalities. First, they define compound inequality and describe the difference between an 'and' and an 'or'...
Curated OER
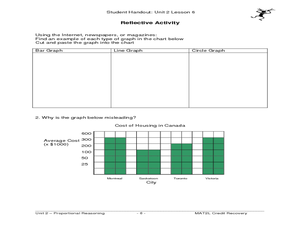
Learning to Make Bar Graphs
Young scholars construct bar graphs using the results from various experiments. In this graphing lesson, students review data from a previous experiment and demonstrate how to construct a bar graph. Young scholars use a checklist to...
Curated OER
Charting and Graphing Sales
Students analyze and represent weekly sales figures using tables, bar graphs, and pie charts. They draw conclusions using bar graphs and pie charts. Students are told that each day at school they have the option of buying or bringing a...
Curated OER
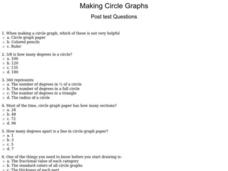
Making Circle Graphs
In this circle graphs worksheet, students answer multiple choice questions about how to make circle graphs. Students answer 10 questions total.
Curated OER
The Circle Graph
For this circle graph worksheet, students complete problems involving many circle graphs including a compass rose, degrees, and more. Students complete 7 activities.
Curated OER
Using Circle Graphs
In this circle graphs worksheet, learners read a story about buying craft materials. Students examine the circle graph that shows how much spent on each type of material. Learners then solve 3 problems using the data shown.
Curated OER
Every Graph Tells A Story
Seventh graders explore linear equations. In this graphing lesson, 7th graders explore constant rates of change. Students discover the real-life application of graphs and demonstrate their ability to read graphs and write...
Curated OER
Solving Inequalities
In this solving inequalities worksheet, 9th graders solve and complete 10 different problems that include various inequalities. First, they add any positive or negative number to both sides of the sign. Then, students multiply or divide...
Curated OER
Problem Solving: Use a Graph: Problem Solving
In this bar graph worksheet, students read the word problem and use the bar graph to complete the problem solving questions for understand, plan, solve, and look back.
Curated OER
Using Graphs and Charts
Students complete T charts and manipulate numbers using graphs and charts. For this math graphs and charts lesson, students review the concepts of pattern and function. Students then complete practice pages where they manipulate numbers...
Curated OER
Making Graphs
Learners explore statistics by conducting class demographic surveys. In this graph making lesson, students identify the family members of each classmate, pets they own, and favorite activities. Learners organize their statistics and...
Curated OER
Graphing Data
First graders explore the concept of graphing. In this data instructional activity, 1st graders gather information from a class survey and display their findings on a picture graph. Students also practice solving problems that their...
Curated OER
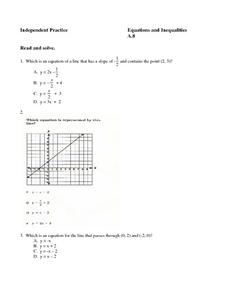
Equations: Graphs, Lines, Slope
In this equations activity, students complete 8 multiple choice questions regarding writing equations in slope-intercept and matching an equation to its graph in the coordinate plane.
Other popular searches
- Inequalities Graph
- Linear Inequalities Graph
- Combined Inequalities Graph
- Solve and Graph Inequalities


