Curated OER
Solving Inequalities
Eighth graders participate in a instructional activity that covers the concept of an algebraic inequality. They practice recognizing the symbols used in an inequality and solving them using the methods that are similar to solving equations.
Curated OER
Linear Inequalities
Ninth graders practice recognizing similarities and differences found in the graphing of inequalities and equations. Once observatioons are made they solve some of their own applying prior knowledge.
Curated OER
System of Two Quadratic Inequalities
Students set up and solve a system of quadratic inequalities related to real-world situations.
Curated OER
Environmental Graphing
Young scholars experiment with graphing. In this graphing introduction lesson, students complete four activities: 1) a bar graph based on class birthdays 2) an estimation graph of the raisins in raisin bread 3) another estimation example...
Curated OER
Rational Function Graphs
Students use algebraic methods to represent and solve problems. Using a graphing calculator, students solve rational and inequality problems. They visually demonstrate solutions of functions through graphing. Students answer questions...
Curated OER
M&M Graphing and Probability
Students create a variety of graphs. They count, sort, and classify M&M's by color and record data on a chart. They use data from the chart to create pictographs, bar graphs and circle graphs. They analyze data and determine...
Illustrative Mathematics
Peaches and Plums
According to the resource graph, which costs more: peaches or plums? Algebra learners compare two proportional relationships and then throw in a banana. Leaving out the scale helps learners become intuitive about graphing.
Curated OER
Evaluating Expressions
In this evaluating expressions worksheet, students solve and complete 50 various types of review problems. First, they complete each sentence and define the listed terms. Then, students evaluate each expression for the given values. They...
Rice University
Elementary Algebra
Find all the Algebra 1 content in one location. A helpful eBook contains the content typically found in an Algebra 1 course. Concepts range from solving and graphing linear equations to solving and graphing quadratic equations....
EngageNY
Polynomial, Rational, and Radical Relationships
This assessment pair goes way beyond simple graphing, factoring and solving polynomial equations, really forcing learners to investigate the math ideas behind the calculations. Short and to-the-point questions build on one another,...
West Contra Costa Unified School District
Slope-Intercept Sort
What's so special about slope? Pupils first match cards with slope and y-intercept to graphs of linear equations. They continue the lesson by matching equations in slope-intercept form to the same graphs.
EngageNY
Solution Sets to Equations with Two Variables
Can an equation have an infinite number of solutions? Allow your class to discover the relationship between the input and output variables in a two-variable equation. Class members explore the concept through tables and graphs and...
Curated OER
Linear Programming
In this algebra worksheet, students calculate the maximum and minimum of a shaded region. They identify the boundaries and their vertices's. There are 2 problems.
Los Angeles County Office of Education
Assessment for the California Mathematics Standards Grade 2
Test scholars mathematic skills with an assessment addressing addition, subtraction, multiplication, place value, measurement, geometric shapes, expanded notation; and their ability to compare numbers, write number...
Centers for Disease Control and Prevention
Microbe Multiplication Magic
A lesson plan introduces the reproduction rate of E. coli though a video. Then scholars complete a data table and graph of reproduction rates in ideal conditions as well as less than ideal conditions.
CK-12 Foundation
Linear Programming: Bakers' Dilemma
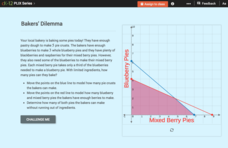
Place the pies in a line. Pupils create a graph of a system of linear inequalities to represent the number of pies a bakery can make. Learners analyze the vertices on the graph to determine the number of pies they can bake without...
Kenan Fellows
Density
Most scholars associate density with floating, but how do scientists determine the exact density of an unknown liquid? The third lesson plan in a seven-part series challenges scholars to find the mass and volume of two unknown liquids....
Inside Mathematics
Population
Population density, it is not all that it is plotted to be. Pupils analyze a scatter plot of population versus area for some of the states in the US. The class members respond to eight questions about the graph, specific points and...
Radford University
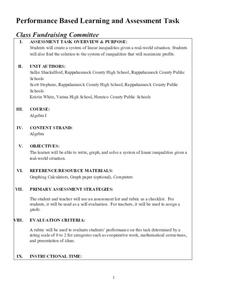
Class Fundraising Committee
Given the task of coming up with a fundraiser, small groups determine the type of fundraiser to hold and restraints on the number of participants. The classmates create inequalities to represent the constraints and graph the solution to...
EngageNY
Multi-Step Problems in the Real World
Connect graphs, equations, and tables for real-world problems. Young mathematicians analyze relationships to identify independent and dependent variables. These identifications help create tables and graphs for each situation.
Flipped Math
Unit 3 Review: Systems of Equations
More practice makes perfect. A review packet helps pupils remind themselves of the content of the unit. They determine whether points are solutions to linear equations, graph systems of equations and inequalities, and solve systems of...
Wisconsin Online Resource Center
Oversized Inch
Each member of the class creates their own paper ruler. Using their ruler, kids walk around the room measuring the objects you've specified. Discuss how items should be measured to the 16th of an inch, the smallest unit on their ruler....
Shodor Education Foundation
InteGreat
Hands-on investigation of Riemann sums becomes possible without intensive arithmetic gymnastics with this interactive lesson plan. Learners manipulate online graphing tools to develop and test theories about right, left, and...
Benjamin Franklin High School
Saxon Math: Algebra 2 (Section 4)
This fourth of twelve units in a series continues the investigation of functions through equations and inequalities. However, the modular nature of the lessons in the section make this an excellent resource for any curriculum...
Other popular searches
- Inequalities Graph
- Linear Inequalities Graph
- Combined Inequalities Graph
- Solve and Graph Inequalities


